


The gold market witnessed remarkable volatility on Friday, culminating in a significant intraday price surge of 1.96%—the most substantial since December 13, 2023. This upward momentum propelled gold to a weekly close at $2088.40, primarily fueled by the market’s reaction to disappointing ISM Manufacturing PMI figures. Subsequently, the market has entered consolidation.
Key Points
- Significant intraday gain of 1.96% on Friday, closing at $2088.40.
- Prices are hovering around new monthly highs, indicating ongoing market sentiment struggles.
- Upcoming Non-Farm Payrolls data is likely to influence market direction.
Gold Daily Price Analysis – 04/03/2024
On Friday, March 2, 2024, the gold market experienced significant activity, with the price of gold posting its best low-to-high intraday gain (+1.96%) since December 13, 2023, closing the week at $2088.40. This bullish movement in the asset was a response to the lower-than-expected ISM Manufacturing PMI data.
As of this writing, gold prices have been ranging around the fresh monthly high, indicating a struggle to keep up with the bullish sentiment in the market. This surge in gold prices is closely watched by traders, especially as the Non-Farm Payrolls (NFPs) data loom, which could further influence the market’s direction.
For traders and investors focusing on the short-term dynamics of the gold market, it’s crucial to monitor these economic indicators and central bank announcements closely. Additionally, considering the technical analysis perspective, identifying key price levels and trends could provide valuable insights for making informed trading decisions. The current bullish trend in gold prices, alongside the anticipation surrounding high-impact economic data and central bank policies, suggests a dynamic market environment that requires careful analysis and strategy adjustment.
Key Economic Data and News to Be Released Today
There is no high-impact news scheduled for release today that could directly move the gold market. However, looking at the broader economic landscape, key events such as statements from central banks, including the Federal Reserve (Fed), the European Central Bank (ECB), and others, as well as upcoming data releases like the NFPs, are critical to watch.
These events can significantly impact market sentiment and the price of gold. For instance, gold’s price movement last Friday and its current levels indicate that investors might be factoring in various economic indicators and central bank policies, assessing their potential impact on inflation, currency values, and, ultimately, the appeal of gold as a safe haven asset.
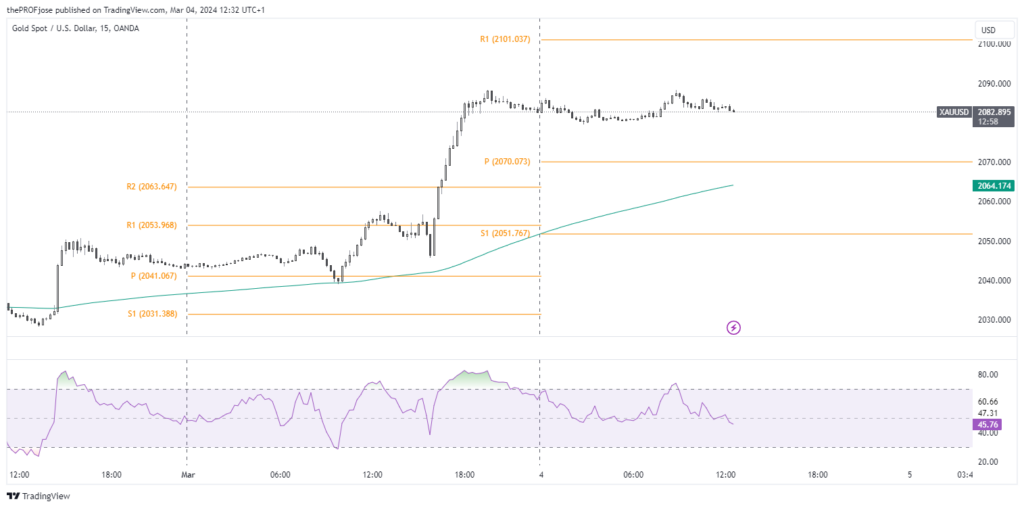
Gold Technical Analysis – 04/03/2024
Technical indicators seem to be smiling at gold prices, with most of them indicating a strong buying potential for the asset. A closer look at the chart below will show that it is currently trending above the intraday 200 EMA.
Gold Fibonacci Key Price Levels 04/03/2024
Short-term traders planning to trade gold today should keep a close eye on the following key price levels for the day:
| Support | Resistance |
| 2080.22 | 2083.92 |
| 2081.24 | 2084.56 |
| 2081.88 | 2085.58 |
Risk Disclosure: The information provided in this article is not intended to give financial advice, recommend investments, guarantee profits, or shield you from losses. Our content is only for informational purposes and to help you understand the risks and complexity of these markets by providing objective analysis. Before trading, carefully consider your experience, financial goals, and risk tolerance. Trading involves significant potential for financial loss and isn't suitable for everyone.


