Everyone knows that when candles keep closing below the previous ones, the bears are in control. And when candles close above the previous candles, the bulls are in control. But how do you tell how much control the bulls or bears have over the price? How do you measure the force behind price movements in whichever direction?
- The Force Index indicator measures the force behind price movements.
- The indicator oscillates above and below a middle zero-line, which puts it in the category of other momentum indicators like the RSI.
- While the indicator is very easy to use and understand, it’s very prone to false signals. As a result, we recommend that you don’t use it in isolation.
That’s where the Force Index comes into play. In the rest of this piece, you’ll learn about the Force Index indicator, how to use it, and how to trade it.
 Table of Contents
- What is the Force Index Indicator?
- How is the Force Index Indicator Calculated?
- How do you Use the Force Index?
- The Force Index Trading Strategy
- What are the Benefits and Limitations of the Force Index Indicator?
- What’s the Difference between the Force Index and the Money Flow Index (MFI) Indicators?
- Bottom Line
What is the Force Index Indicator?
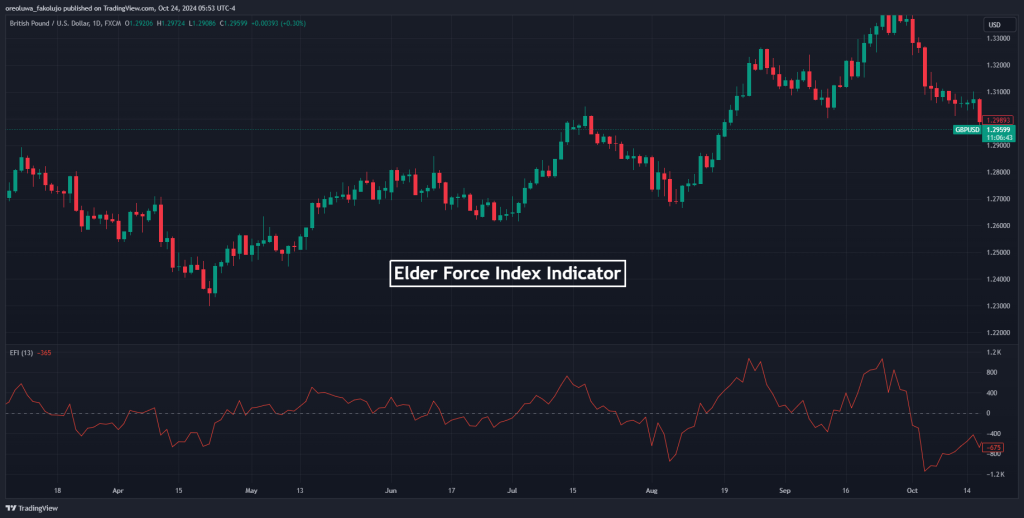
The Force Index indicator uses price and volume data to determine the force of the bulls behind a bullish price movement and the bears behind a bearish price movement. In other words, it measures the strength of the move or the force with which a move is ongoing.
The idea behind this technical analysis indicator is that traders can deduce how much force a trend is moving with and be able to get in on that trend. It’ll also help traders deduce when a trend is without any significant force, suggesting that they stay out of trading.
The Force Index indicator was developed by Dr. Alexander Elder and published in 1993. That’s why the indicator is also called the Elder Force Index. Unlike many momentum and force indicators, the force index does not have boundaries on the upper and lower sides of the middle line. As such, it can keep going as high as possible, as long as the force keeps rising, or as low as possible, as long as the bearish force keeps increasing.
How is the Force Index Indicator Calculated?
The Force Index works based on two calculation levels. The first one involves the calculation of the main indicator, while the second one involves the smoothing of the indicator with an Exponential Moving Average.
To calculate the core indicator, we need three components. The first is the close price of the current candle. The second is the close price of the previous candle, and the third is the current trading volume.
Force Index = (Current Close Price – Previous Close Price) * Current Volume
For the smoothening part, the indicator has the 13 EMA applied to it.
At the end of the day, we have an indicator line oscillating above and below a midline. And the bulls are getting strong whenever the indicator line goes above the midline. And whenever the indicator goes below the midline, the bears are gaining strength.
How to Use the Force Index in Trading?
The Force Index indicator can be used as a trend-following tool, a divergence indicator, and an overbought/oversold condition spotter.
1. Divergence
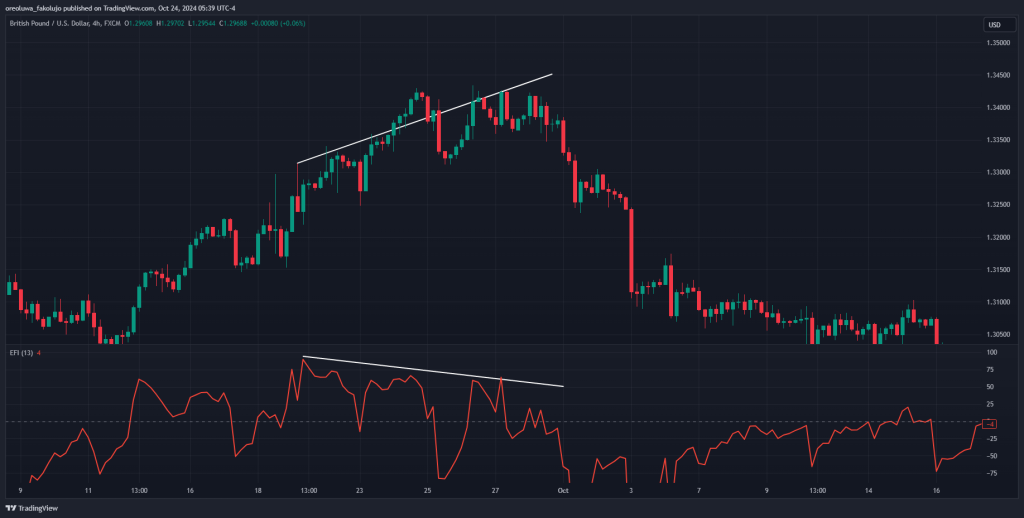
The Elder Force Index indicator oscillates from one side of the midline to the other. As a result, it can be used as a divergence indicator, and quite simply.
When the price is constantly rising, but the indicator is dropping, expect the price to follow the steps of the indicator and drop. This is called a bearish divergence. Conversely, if you find the price falling while the indicator rises, this might be a sign that the price is about to start rising. We call this a bullish divergence.
2. Readings above and below 0

The movement of the indicator between the positive and negative territory is the most basic use of the Force Index. When we have a positive Force Index (the indicator line rises above the zero line), this is a signal that the bulls are gaining strength. And when we have a negative Force Index (the indicator line falls below the zero line), the bears are looking stronger. If there isn’t enough strength in the market, the Force Index directly sits on or hovers around the zero line.
However, be careful not to use this tool in isolation. At best, the Force Index is a bias confirmation tool.
3. Overbought and Oversold Conditions

Just like other oscillators, such as the Relative Strength Index, the Force Index can be used in overbought and oversold conditions.
While the indicator doesn’t come with overbought and oversold boundaries, you can create yours. Most traders use the +50 and -50 boundaries, but you can always experiment to see what suits you the best.
So, when the indicator falls below the -50 boundary, the price is oversold and likely to reverse. When the indicator rises above the 50 boundary, the price is overbought and likely to reverse.
The Force Index Trading Strategy
We’ll be using the Force Index indicator in conjunction with the 50EMA for a simple strategy. The EMA will be the trend confirmation tool, while the Force index generates our trading signals.
Trade Setup
The 50EMA tells us the current trend of the market. Whenever the price crosses the 50 EMA to the upside, we’re bullish. And whenever the price crosses the 50 EMA to the downside, we’re bearish.
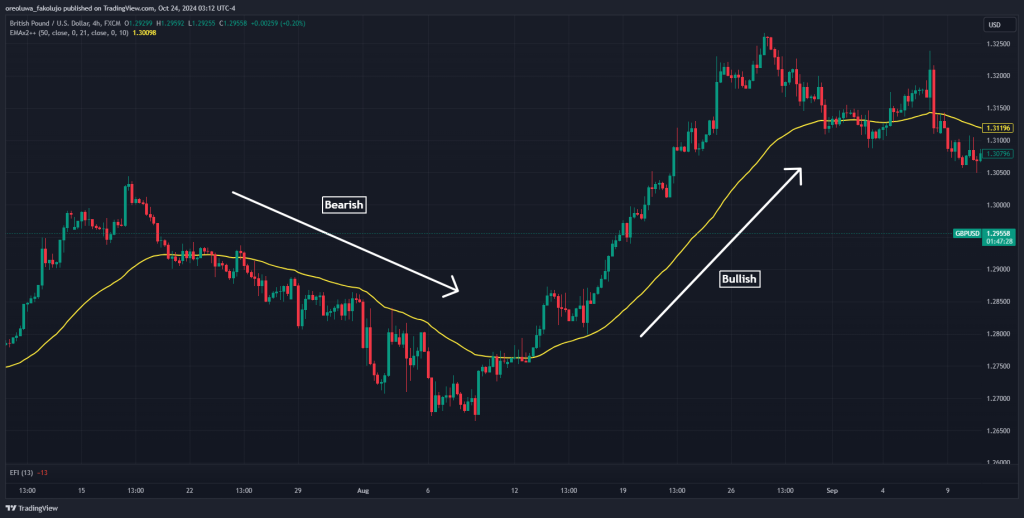
Next, we use the Force Index to confirm the bias and get in on trades. Whenever the Force Index indicator crosses the midline to the upside during a bullish trend, we buy. And whenever the Force Index crosses the midline to the downside during a bearish trend, we sell. Otherwise, we wait and do nothing.
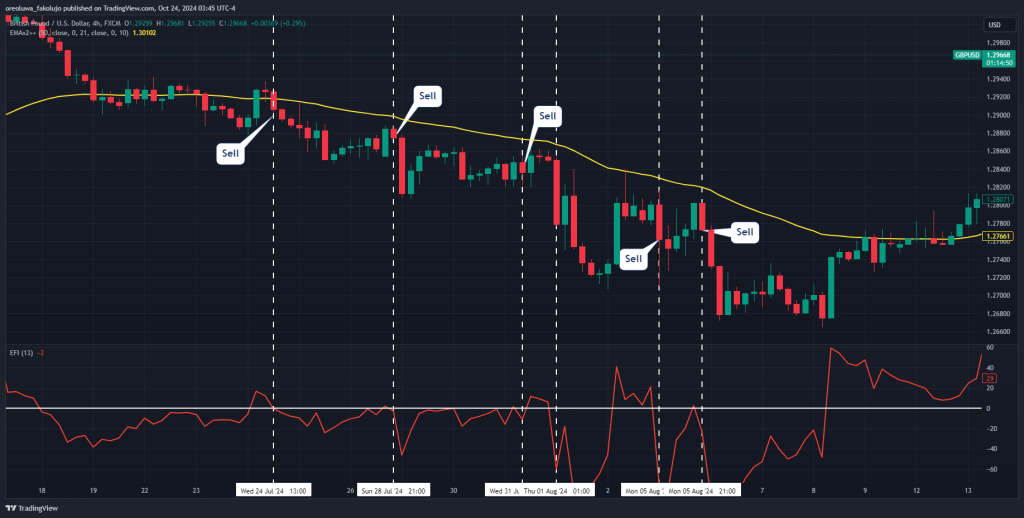
Be careful, however. This strategy is as simple as it gets. You can make it a bit more advanced by adding more indicators or trading concepts.
Risk Management
Risk management is an important part of early trading strategy. And this is how we set it for this particular trading strategy. Place it below the recent swing low in a bullish trade for your stop loss. And if you are taking a bearish trade, place it above your most recent swing high.
Your profit target should be a simple 1:2 risk-to-reward ratio. Also, if you’re in any trade when the price crosses the 50 EMA to the opposing side, close those trades. For instance, close bearish trades when EMA gives a bullish signal and close bullish trades when EMA gives a bearish signal.
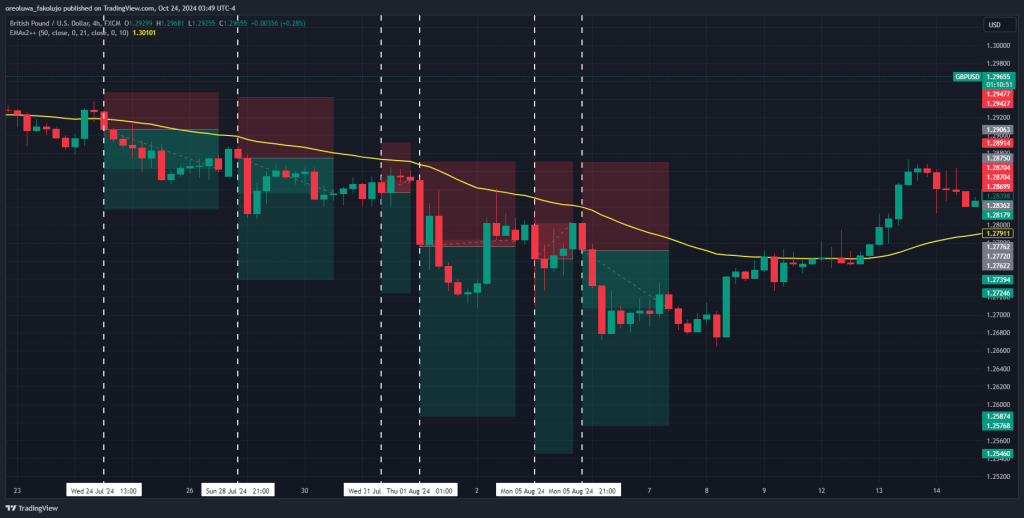
In our GBPUSD example, we took six bearish trades where three hit our profit target, and the remaining three ended as almost break-even trades.
What are the Benefits and Limitations of the Force Index Indicator?
One thing the Force Index indicator has going for it is that it is very easy to use. Any beginner can pick it up and understand its signals. However, it is important to note that the Force Index should only be used to confirm a signal, not as a standalone indicator. Another advantage of the Force Index indicator is that it is not bounded like other momentum indicators. As a result, you can see how the force of the market grows without any boundary to stop it.
On the flip side, the indicator lags. It uses the closing price of the previous day and the current trading day to generate its signals. Because of this, it will always respond slowly to market movements. Another potential disadvantage is that it is prone to false signals. To be fair, though, this disadvantage is not peculiar to the Force Index indicator. Many other indicators are plagued by this same disadvantage.
What’s the Difference between the Force Index and the Money Flow Index (MFI) Indicators?
The Money Flow Index and the Force Index indicators both measure momentum. However, the MFI uses a slightly more complex calculation, so it gives a different signal from the Force Index.
To know which is better for you, test both indicators and see which works well for your trading strategy.
Bottom Line
Summarily, the Force Index indicator helps you to measure the strength of the bulls in a bullish trend and the strength of the bears in a bearish trend. However, don’t rely on it as a standalone tool. Use it alongside other indicators or trading concepts. Only then can you filter out many of its false signals and maximize its potential.
Risk Disclosure: The information provided in this article is not intended to give financial advice, recommend investments, guarantee profits, or shield you from losses. Our content is only for informational purposes and to help you understand the risks and complexity of these markets by providing objective analysis. Before trading, carefully consider your experience, financial goals, and risk tolerance. Trading involves significant potential for financial loss and isn't suitable for everyone.


