


The S&P 500 index lost a significant 1.31% after disappointing unemployment data and Fed official’s hawkish statement. All eyes are on the Nonfar payrolls data to be released later today.
Key Points
- The S&P 500 took a 1.31% hit from a hawkish Fed official remark and higher unemployment rate filing.
- DJI and Nasdaq stocks also suffered a similar decline.
- The key level for the price will now be $5206.
S&P 500 Daily Price Analysis – 05/04/2024
The index lost 1.31% on Thursday after a Fed official made an aggressively hawkish statement, and the Initial Jobless Claims report came out worse than expected. The price currently trades 0.28% upward.
Neel Kashkari, the Minnesota Federal Reserve President, remarked that interest rate cuts this year might not be necessary if measures against inflation proved futile. In addition, Thursday’s Initial Jobless Claims report revealed 221,000 unemployed, 8,000 more than economists expected. And due to tensions in the Middle East, oil prices have also spiked.
Various S&P 500 sectors suffered, with the tech sector now down by 1.72%, the financials sector down by 1.17%, and the communications services sector by 1.39%. S&P 500 stocks aren’t the only ones taking a hit. Dow Jones and Nasdaq are also down by 1.35% and 1.4%, respectively.
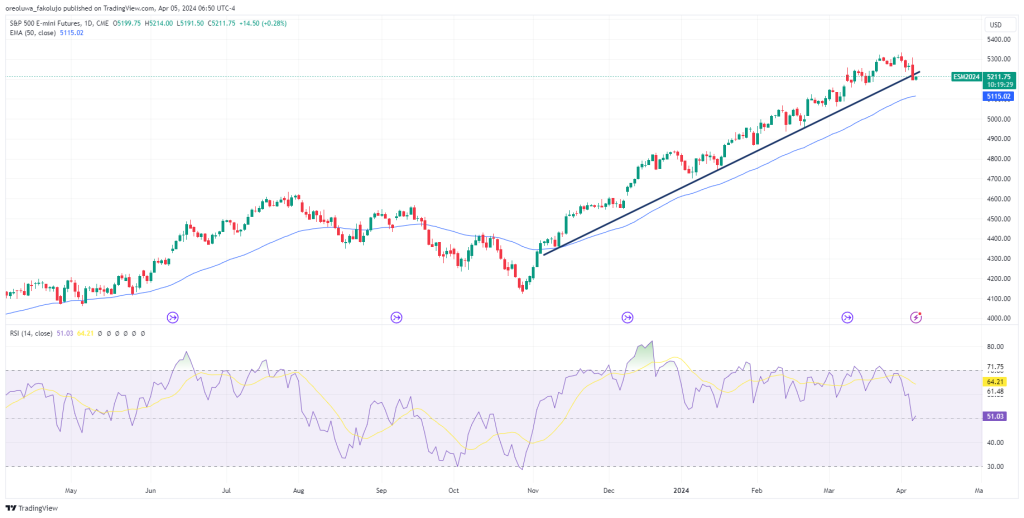
On the technical front, the 50 EMA maintains a strong bullish outlook for the pair, with the price trading relatively far above the indicator line. The RSI, though, doesn’t share that sentiment, as the indicator sits right on the midway point between its bullish and bearish.
S&P500 Intraday Technical Analysis – 05/04/2024
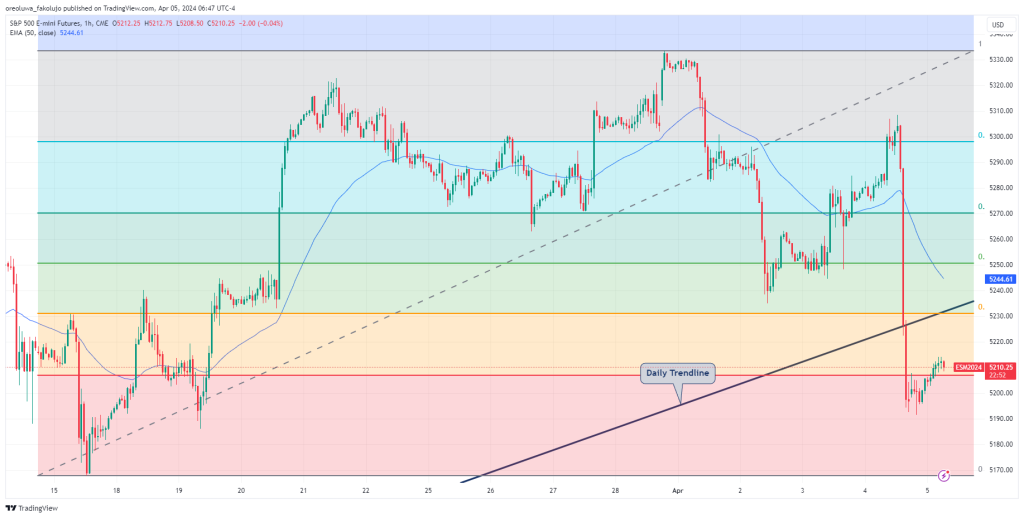
The 1.31% dip in the index caused the price to break below the daily bullish trend it’s been riding since November last year.
Plotting the Fibonacci Retracement tool to measure the retracement, we notice that the price temporarily dipped below the 0.236 ($5206.75) Fib level before slightly rising above it. However, a further decline could bring the price back below this level and then towards the $5167.75 swing low.
On the bullish side, the price has to claw its way past 0.382 ($5231), 0.5 ($5250.75), 0.618 ($5270.25), and 0.782 ($5298) Fib levels to reach the major swing high of $5333.5 and continue its bullish run.
Key Economic Data and News to Be Released Today
Today will be interesting for investors as major news events, such as non-farm payroll, average hourly earnings, and the unemployment rate, will be released. All of these factors can affect the direction of the United States’ interest rate.
S&P500 Fibonacci Key Price Levels 05/04/2024
Based on the hourly chart, here are the key S&P 500 Fibonacci support and resistance levels to watch as of 14/02/2024.
| Support | Resistance |
| $5206.75 | $5231.00 |
| $5167.75 | $5250.75 |
| $5270.25 | |
| $5298.00 |
Risk Disclosure: The information provided in this article is not intended to give financial advice, recommend investments, guarantee profits, or shield you from losses. Our content is only for informational purposes and to help you understand the risks and complexity of these markets by providing objective analysis. Before trading, carefully consider your experience, financial goals, and risk tolerance. Trading involves significant potential for financial loss and isn't suitable for everyone.


