


Following yesterday’s FOMC, the S&P 500 has taken a new high, closing above the $5200 mark for the first time. Today, the index struggles to keep the bullish momentum amidst jobless claims and manufacturing PMI data.
Key Points
- S&P 500 Closes above $5200 yesterday, trading above $5300 today
- Chair Powell maintained the inflation rate for the third time and held its forecast for three rate cuts this year.
- The index remains bullish, although the RSI suggests that the index may be overbought.
S&P 500 Daily Price Analysis – 21/03/2024
The S&P 500 experienced a remarkable session yesterday. The Index soared, closing above the 5,200 threshold for the first time ever, marking a significant milestone for the market. The index ended the day at 5,224.62, up from an opening price of 5,181.69, reflecting a gain of 0.89%. The rally was primarily fueled by the Federal Reserve’s latest policy decision, which came as a relief to investors.
The Fed announced that it would maintain the current interest rate levels, continuing a trend seen over the past five policy meetings. This decision has been interpreted as a dovish stance by the central bank, which has also signaled potential rate cuts ahead, further easing investor concerns over the inflationary pressures that have been a headwind for markets in recent months.
The Fed’s commitment to keeping interest rates unchanged, coupled with its anticipation of three rate cuts before the end of 2024, has bolstered market confidence. Notably, Morgan Stanley has forecasted a series of rate adjustments starting in June, anticipating a more accommodative monetary policy environment conducive to growth.
Today, the S&P 500 has seen a slight retracement, opening at 5,254.78 and currently trading at 5,171.55, with a 0.53% increase in value. The high of 5,260.28 earlier today indicates continued investor optimism, although the market is consolidating gains after yesterday’s surge.
Key Economic Data and News to Be Released Today
The Federal Reserve’s recent decisions underscore its strategic patience. It opted to wait for more data before proceeding with rate cuts. This approach, along with remarks from Fed Chair Powell highlighting the strength of the economy and labor market and the reduction in inflation, points to a cautiously optimistic outlook for the markets.
Both Jobless claims and Manufacturing PMI data releases this afternoon turned out to be better than expected, giving hope to investors and showing considerable positive room for the index to climb higher.
S&P 500 Technical Analysis – 21/03/2024
On the technical analysis side, the S&P 500 price action agrees with the fundamental bias, trending above the 200 EMA.
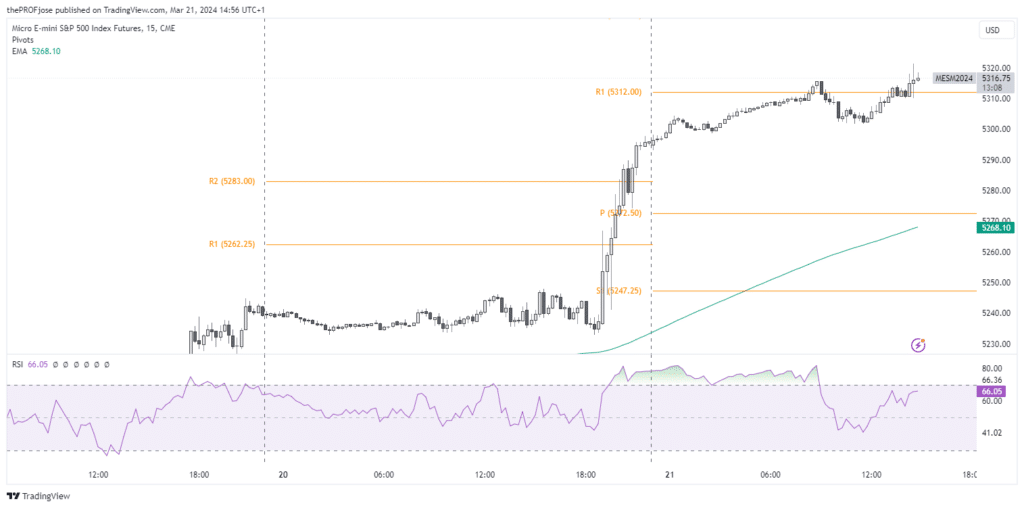
Currently, the price has closed above the R1 resistance level, giving us a breakout pattern to ride the index price further higher. However, investors should closely monitor how the index reacts to future resistance levels, as the RSI signifies that the S&P 500 may be overbought.
S&P 500 Fibonacci Key Price Levels 21/03/2024
Traders should keep a close eye on the following key price levels for the day:
| Support | Resistance |
| 5202.68 | 5226.87 |
| 5209.37 | 5230.99 |
| 5213.49 | 5237.68 |
Risk Disclosure: The information provided in this article is not intended to give financial advice, recommend investments, guarantee profits, or shield you from losses. Our content is only for informational purposes and to help you understand the risks and complexity of these markets by providing objective analysis. Before trading, carefully consider your experience, financial goals, and risk tolerance. Trading involves significant potential for financial loss and isn't suitable for everyone.


