


At the beginning of the year, expectations were that a slowing economy would force the Fed to gradually ease the ever-so-high interest rate. But we had a Q1 full of sticky inflation data, forcing the Feds to keep the rates higher for longer. However, recent CPI data, including Wednesday’s, are looking more like the beginning-of-the-year projections, suggesting that inflation is finally cooling off and a rate cut may be around the corner.
Key Points
- After a red-hot Q1, Wednesday’s CPI reports confirm slowing economic activity in the United States.
- Rumors of multiple rate cuts are once again getting louder.
- The 5333.50 is a key level for the price in Thursday’s trading session.
S&P 500 Daily Price Analysis – 16/05/2024
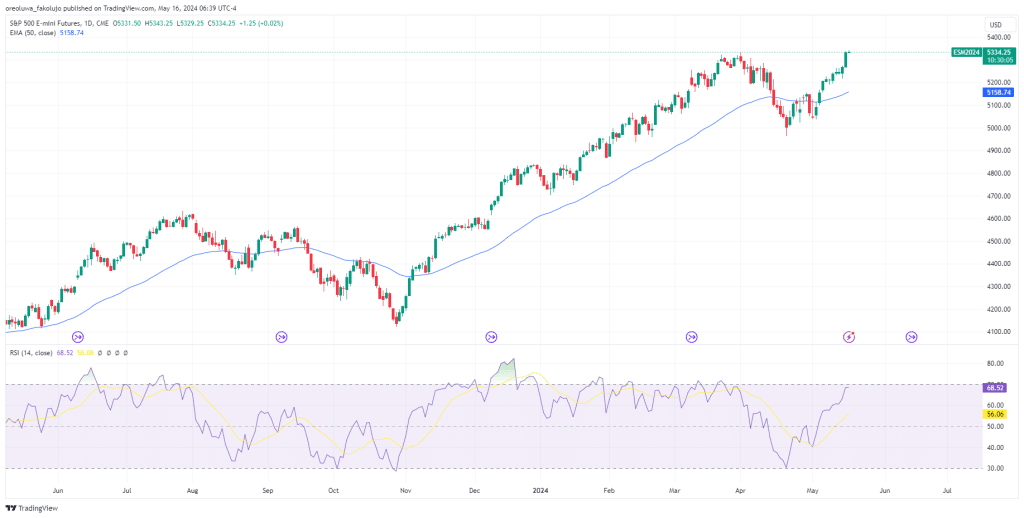
The S&P 500 futures rose significantly by 1.21% on Wednesday, bagging an all-time high and extending the index futures’ 10-day winning streak. Today, SPX futures look to continue on the same path, already gaining 0.09% pre-market opening.
Yesterday, MoM Core CPI came in at 0.3, less than 0.4 from the previous month. MoM CPI recorded the same figures. Quite significantly, core retail sales for April dropped to 0.2% from 0.9% the previous month.
Thanks to these figures, talks of multiple rate cuts in 2024, which were once swept under the carpet after Q1’s steaming hot figures, have now resurfaced. According to the CME FedWatch tool, the chances of a rate cut in September have now risen to 73% from about 65% on Tuesday.
From the technical point of view, major technical indicators all give a clear bullish outlook for the index futures, including the 50 EMA. The RSI oscillator, however, has now wandered very close to the overbought zone, suggesting that a retracement might happen soon.
S&P500 Intraday Technical Analysis – 16/05/2024
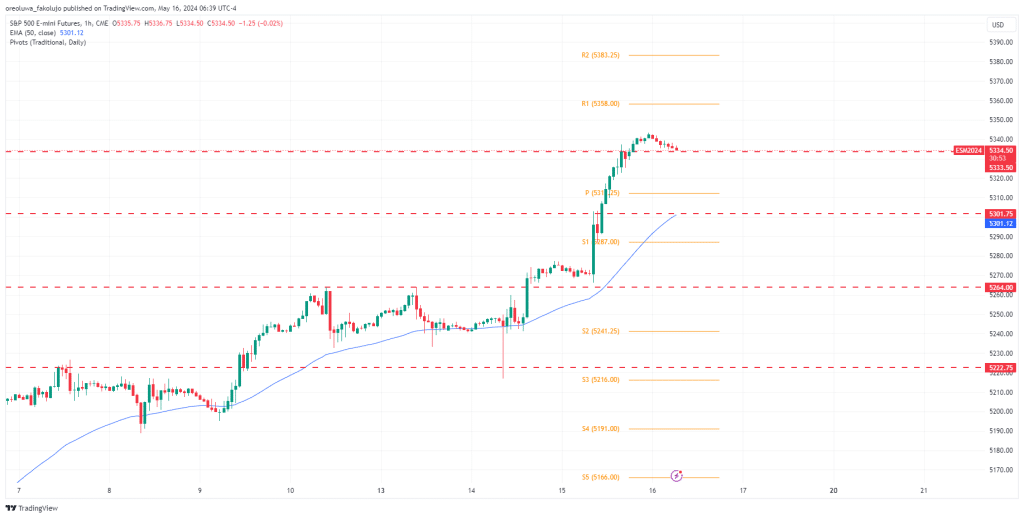
The most immediate challenge for SPX bulls will be to stay above the previous all-time high of 5333.50, which now sits as support after yesterday’s price action. If this support fails, lower support levels await the price at 5301.75, 5264, and 5222.75.
According to the Traditional Pivot Points indicator, the closest potential resistance level is 5358.
Key Economic Data and News to Be Released Today
After an eventful last two days, things are set to get more interesting, with the Initial Jobless Claims report set to be released later today. Not too long after, the Philadelphia Fed Manufacturing Index for the month of May takes center stage. We also have the United States Industrial and Manufacturing Production reports lined up, followed by testimonies from notable Fed officials.
S&P500 Pivot Point Levels 16/05/2024
Based on the hourly chart, here are the key S&P 500 Piot Point levels to watch as of 16/05/2024.
| S2 | S1 | P | R1 | R2 |
| 5241.25 | 5287 | 5312.25 | 5358 | 5383.25 |
Risk Disclosure: The information provided in this article is not intended to give financial advice, recommend investments, guarantee profits, or shield you from losses. Our content is only for informational purposes and to help you understand the risks and complexity of these markets by providing objective analysis. Before trading, carefully consider your experience, financial goals, and risk tolerance. Trading involves significant potential for financial loss and isn't suitable for everyone.


