


The SP500 index ended last week with a substantial gain. Like last week, this week will be crucial in determining the medium-term direction for the S&P 500 because of the barrage of important news releases ahead.
Key Points
- Last week was the first positive week for the S&P 500 index since the beginning of Q2.
- The FOMC press conference and interest rate decision will take center stage this week, followed by the Non-Farm Payroll report.
- The 5148.50 is a key level for the price in Monday’s trading session.
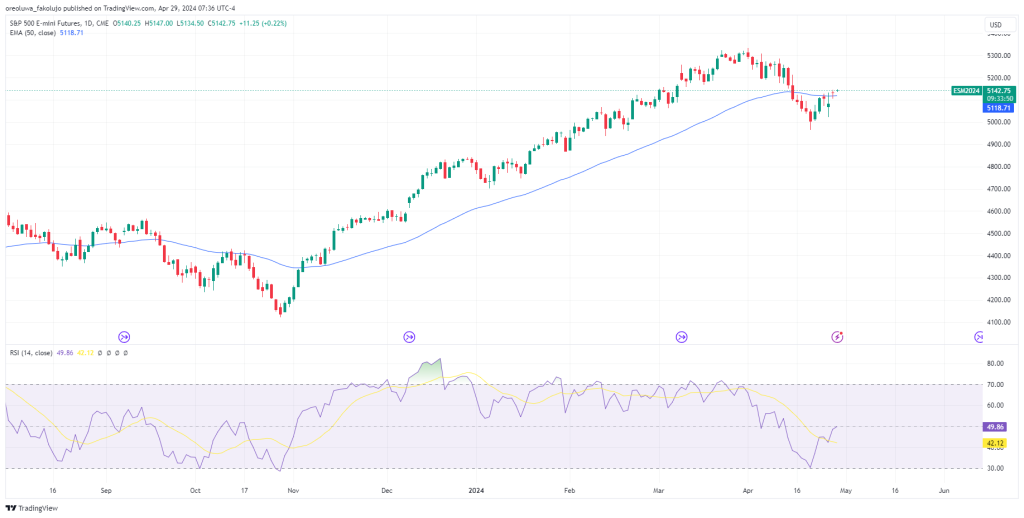
S&P 500 Daily Price Analysis – 29/04/2024
The index had the first positive week since the opening of Q2, rising by 2.35% across the week and 0.98% on Friday alone. The index futures is up by 0.23% on Monday’s pre-New York session.
This rally has come on the back of an eventful week with major news releases. Going into this week, the Fed Meeting on Wednesday is the elephant in the room. While no interest rate is likely to remain unchanged during this meeting, investors will keep close tabs on it to get a hint of the Fed’s decision. And just as important is Fed Chair Powell’s speech after the meeting.
From the corporate perspective, major S&P 500 companies, including Coca-Cola, Amazon, Apple, and McDonald’s, will be making their earnings public. So far, corporate earnings have been positive for the S&P 500 stocks, with four out of five beating expectations.
Technically, the price has edged above the 50 EMA on the daily chart, while the RSI remains just below the midpoint. Judging from these two indicators, the outlook is still not very clear. However, whatever happens during and after Monday’s trading session may lend more clarity to the direction of the index.
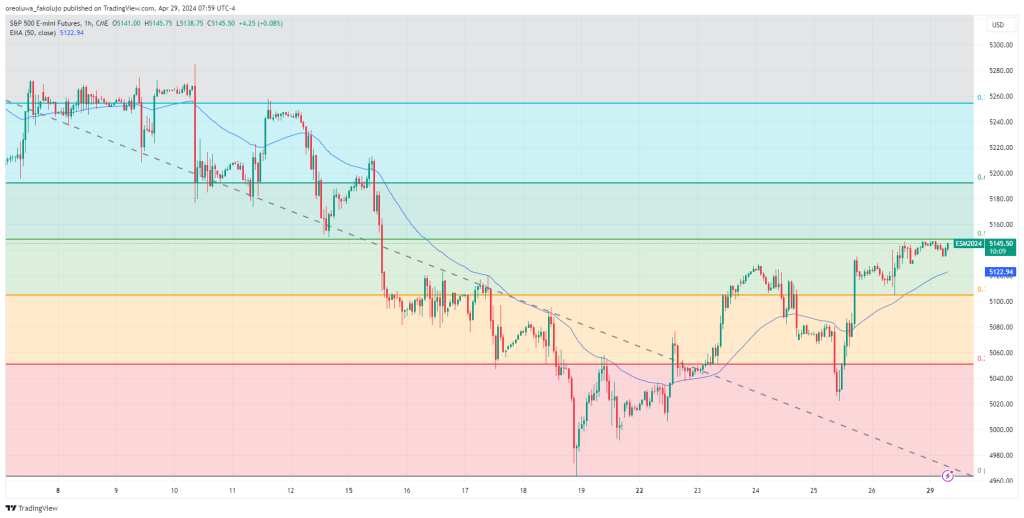
S&P500 Intraday Technical Analysis – 29/04/2024
After hitting strong support at 4963.50, the price has since made a strong pullback. On the Fibonacci Retracement tool, the index is about halfway away from the April 1st swing high of 5333.50. The 0.5 (5148.50) Fib level just hangs above the price as a resistance level.
Going into the trading session today, we might see a continuation of the pullback, taking the price past the 0.5 (5148.50) fib level and towards the 0.618 (5192.25) fib level. If this pullback doesn’t have enough force to push past the 0.5 (5148.50) fib level, it might have to find support at the 0.382 (5104.75) fib level. And if this support fails, the lower 0.236 (5050.75) fib level waits as another key support level.
Key Economic Data and News to Be Released Today
This busy week starts out with a light Monday. The Chicago PMI and CB Consumer Confidence data will be released on Tuesday. The next day, the FOMC will take center stage with its interest rate decision and its press conference shortly afterward. Before then, the ADP Non-Farm Payroll and S&P Global US Manufacturing PMI reports go live. Thursday comes with the initial Jobless Claims report before we wrap up the week with the Nonfarm Payroll, Unemployment rate, and the S&P Global US Services PMI.
S&P500 Fibonacci Price Levels 29/04/2024
Based on the hourly chart, here are the key S&P 500 Fibonacci levels to watch as of 29/04/2024.
| Support | Resistance |
| 5104.75 | 5148.50 |
| 5050.75 | 5192.25 |
| 4963.50 | 5254.25 |
Risk Disclosure: The information provided in this article is not intended to give financial advice, recommend investments, guarantee profits, or shield you from losses. Our content is only for informational purposes and to help you understand the risks and complexity of these markets by providing objective analysis. Before trading, carefully consider your experience, financial goals, and risk tolerance. Trading involves significant potential for financial loss and isn't suitable for everyone.


