


The Nasdaq 100 saw a slight increase, rising by 0.44% today following an increase of 1.48% yesterday, influenced by Tesla’s 10% surge despite its Q1 earnings decline, as it announces faster rollout of new models.
Key Points
- U.S. economic data shows mixed signals, with manufacturing PMI dropping and home sales rising.
- A full slate of earnings reports from major companies, including Meta Platforms, IBM, and Boeing, is due today, which could significantly sway market sentiment.
- Market watches for the impact of upcoming U.S. Durable Goods data, which is expected to show significant growth.
NASDAQ 100 Daily Price Analysis – 24/04/2024
Yesterday, the Nasdaq 100 closed at 17,352.25, reflecting a gain of 1.48% from its opening at 17,606.75. This positive shift was influenced by strong buying pressure in the tech sector, even as broader market sentiment was cautious.
Today, the Nasdaq 100 futures trade is slightly higher at 17,682, and at the latest, it trades at 17,687.47, marking a moderate increase of 0.44%. This morning’s rise is driven primarily by a notable surge in Tesla stock, which jumped over 10% in pre-market trading. Despite Tesla’s reported decline in Q1 revenue and earnings, its aggressive strategy to expedite the launch of new, more affordable models has excited investors, propelling the stock and influencing the index positively.
On the economic data front, yesterday’s U.S. S&P Global manufacturing PMI fell unexpectedly to a 4-month low at 49.9, indicating a slight contraction in the sector. However, the services sector PMI at 50.9, although below expectations, stayed in the expansion territory. Additionally, new home sales outperformed expectations, hitting a six-month high, which could suggest underlying strength in consumer confidence and the broader economy.
Key Economic Data and News to Be Released Today
Today is packed with high-impact economic data that could sway market sentiment. The U.S. Durable Goods Orders are anticipated to show a growth of 2.5% month-over-month for March, an acceleration from February’s 1.3%. If this data exceeds expectations, it could signal strengthening economic conditions and potentially drive market gains.
Similarly, the U.S. Core Durable Goods Orders, expected to post a modest increase of 0.3% month-over-month, will be closely watched as an indicator of business investment.
Investors are also keyed into the U.S. Crude Oil Inventories, with analysts predicting a decrease to 1.600M from 2.735M last week. A significant deviation from these expectations could impact energy stocks and, by extension, broader market indices.
US100 Technical Analysis – 24/04/2024
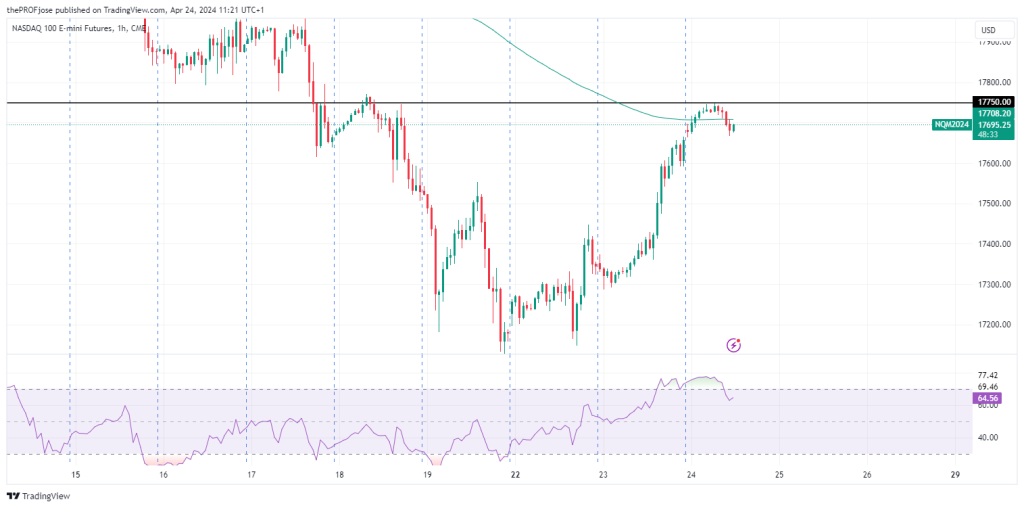
On the 1-hour timeframe, the US100 is currently testing the 200 EMA, closely approaching the resistance level at 17,750. Additionally, the RSI is indicating an overbought condition. These technical signals collectively suggest potential bearish pressure in the near term, hinting at a longer-term downtrend or at least a pullback from current levels.
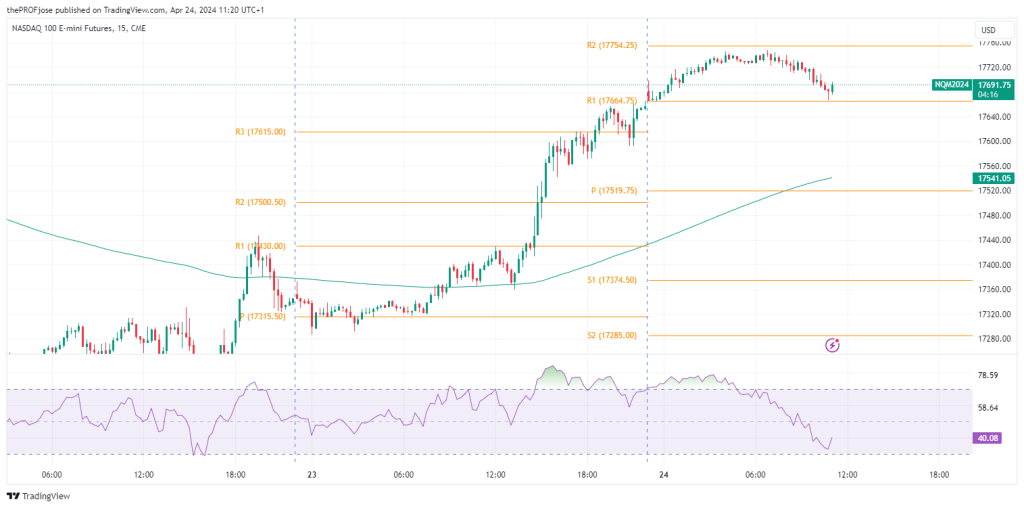
On the other hand, the M15 chart shows a strong bullish trend. The index is trading well above the 200 EMA, indicating robust short-term upward momentum. This bullish setup on the shorter timeframe reflects an active buyer’s market in the immediate term, suggesting that the bullish trend could continue unless countered by broader market shifts.
Given the conflicting signals from the H1 and M15 timeframes, it is prudent for traders to exercise caution. The convergence of a potential resistance point and overbought RSI on the hourly chart against the bullish momentum seen on the 15-minute chart suggests a complex trading environment. It would be wise to await further clarity, particularly post-release of the high-impact economic data due later today, before committing to significant positions.
NASDAQ100 Fibonacci Key Price Levels 24/04/2024
Here are some critical support and resistance levels to pay attention today:
| Support | Resistance |
| 17374.50 | 17664.75 |
| 17285.00 | 17754.25 |
| 17140.00 | 17899.50 |
Related Articles:
Risk Disclosure: The information provided in this article is not intended to give financial advice, recommend investments, guarantee profits, or shield you from losses. Our content is only for informational purposes and to help you understand the risks and complexity of these markets by providing objective analysis. Before trading, carefully consider your experience, financial goals, and risk tolerance. Trading involves significant potential for financial loss and isn't suitable for everyone.


