Last week’s Nasdaq 100 gain of 1.24% reflects optimism fueled by strong employment data, suggesting a more resilient US economy than anticipated. A slight retracement from NAS100 record levels in today’s session indicates investor caution ahead of forthcoming economic data and policy signals.
Key Points
- Hawkish Fed tones and solid economic reports curb rate cut expectations amid Nasdaq’s broader uptrend.
- Upcoming CPI data and Fed commentary will shape market expectations and Fed policy direction.
- Nasdaq 100’s technicals suggest short-term bullish moves with crucial support/resistance levels in focus.
NASDAQ 100 Daily Price Analysis – 08/04/2024
Last week, the Nasdaq 100 closed at 18,300.75, marking a 1.24% increase from its opening at 18,086.25. The uplift can largely be attributed to the strong employment figures on Friday that mitigated some concerns about the pace of economic growth, hinting at a more resilient US economy than previously thought. The better-than-expected payroll data on Friday seems to convince investors that a rate cut is not likely to happen in the near future, which pushed the USD100 into record levels.
This optimism, however, appears to be waning in today’s session, with the index slightly retracting by 0.05% from an opening of 18,319.75 to a current price of 18,292.00. This suggests a cautious stance among investors, likely due to anticipation of upcoming economic data and policy signals.
The Nasdaq’s trajectory last week, which saw a 0.8% decline, marked its fourth negative week in five, reflecting growing uncertainties among investors, although the index continues to moderately push higher. These uncertainties are compounded by a shift in expectations around the Federal Reserve’s interest rate policy. Hawkish comments from Fed officials and stronger-than-anticipated manufacturing and jobs reports have lessened the urgency for immediate rate cuts, aligning with a broader perspective of a resilient US economy.
Key Economic Data and News to Be Released Today
Investors’ attention is now squarely focused on the forthcoming economic indicators, notably the U.S. Consumer Price Index (CPI) for March later this week on Wednesday, which is anticipated to reveal a slight uptick in inflation to 3.4% year-on-year from February’s 3.2%. This data will be critical in shaping expectations around the Federal Reserve’s monetary policy direction, particularly in light of recent strong employment data, which has introduced some skepticism regarding the timing of the Fed’s first interest rate cut, previously expected by some to occur as soon as June.
Furthermore, remarks from Chicago Fed President Austan Goolsbee and Minneapolis Fed President Neel Kashkari, expected later today, will be closely monitored for insights into the central bank’s outlook on the economy and monetary policy. These comments, along with the impending inflation data, could significantly influence market sentiment and the Nasdaq 100’s performance, offering either reassurance or reasons for caution to investors.
US100 Technical Analysis – 08/04/2024
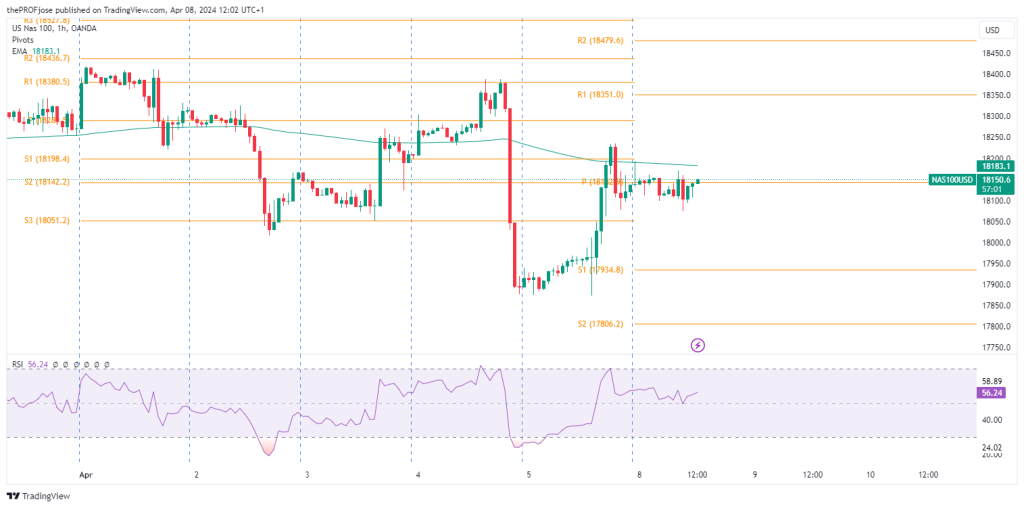
Despite a notable pullback on Friday, the index’s position below the 200 EMA serves as a clear bearish signal, indicating that the long-term momentum remains inclined toward the downside.

However, the early hours of today show that the index is reversing, having hit the oversold level according to the RSI. Should the Nasdaq 100 close above the pivot level and the 200 EMA, it would further solidify the uptrend, hinting at a lack of selling pressure sufficient to continue the current bearish momentum.
NASDAQ100 Fibonacci Key Price Levels 08/04/2024
The technical setup suggests a cautious approach as the index is testing critical support levels. In view of this, here are some critical support and resistance levels to pay attention to:
| Support | Resistance |
| 17934.80 | 18351.00 |
| 17806.20 | 18479.60 |
| 17598.10 | 18687.70 |
Risk Disclosure: The information provided in this article is not intended to give financial advice, recommend investments, guarantee profits, or shield you from losses. Our content is only for informational purposes and to help you understand the risks and complexity of these markets by providing objective analysis. Before trading, carefully consider your experience, financial goals, and risk tolerance. Trading involves significant potential for financial loss and isn't suitable for everyone.


