


Yesterday, the Nasdaq 100 saw a slight decrease, ending the day at 18,328.50, a -0.81% change, amidst a volatile trading environment. Today, it shows a modest recovery, trading up by +0.22%, reflecting cautious optimism in the market.
Key Points
- High-impact economic data released today indicates inflationary pressures and consumer resilience, potentially affecting Federal Reserve policies.
- The Nasdaq 100 is currently trading below key technical indicators like the 200 EMA, suggesting bearish sentiment but also hinting at a possible reversal due to oversold conditions.
- Traders should keep their eyes on relevant key levels, and fundamental data.
NASDAQ 100 Daily Price Analysis – 14/03/2024
Nasdaq 100 experienced a slight dip in yesterday’s trading session, closing at 18,328.50, down from an opening of 18,469.50, marking a -0.81% change. The day witnessed a trading range between 18,506.75 (high) and 18,281.75 (low), indicating volatility within the tech-heavy index. This downturn reflects investor caution amid a backdrop of economic uncertainty and potential profit-taking after recent gains.
Today, the Nasdaq 100 is currently trading at 18,353.50, reflecting a modest increase of +0.22% from yesterday’s close, despite a higher than expected CPI data released on Monday. Overall, the general sentiment in the market suggest that the Fed is likely to keep rates higher in 2024.
Today, the index opened at 18,371.00 and saw a high of 18,427.75 and a low of 18,354.00, suggesting a tight trading range and cautious optimism among traders. This slight uptick may be attributed to speculative buying, portfolio adjustments, and reactions to overnight news and global market trends.
Key Economic Data and News to Be Released Today
Several high-impact economic data releases may significantly influence the trading day. Today’s release of Core PPI m/m at 0.3% against a forecast of 0.2%, alongside PPI m/m at 0.6% compared to an expected 0.3%, suggests inflationary pressures may not be easing as quickly as hoped, potentially leading to tighter monetary policy by the Federal Reserve.
Furthermore, retail sales m/m showed a 0.6% increase, indicating consumer resilience but still below the forecasted 0.8%. The Core Retail Sales, also up by 0.3% versus an anticipated 0.5%, along with Unemployment Claims at 209K against a forecast of 218K, could signal a robust economic environment but with nuances that could affect investor sentiment and monetary policy outlooks.
Investors will be keenly watching how these figures, especially the higher-than-expected PPI, could influence future inflation expectations and, consequently, tech sector valuations.
NAS100 Technical Analysis – 14/03/2024
Following the release of high-impact USD economic data, the Nasdaq 100 trended below the intraday 200 EMA and the daily pivot point, indicating bearish market sentiment. However, a detailed examination of additional technical indicators suggests a contrary perspective on the direction of the price movement.
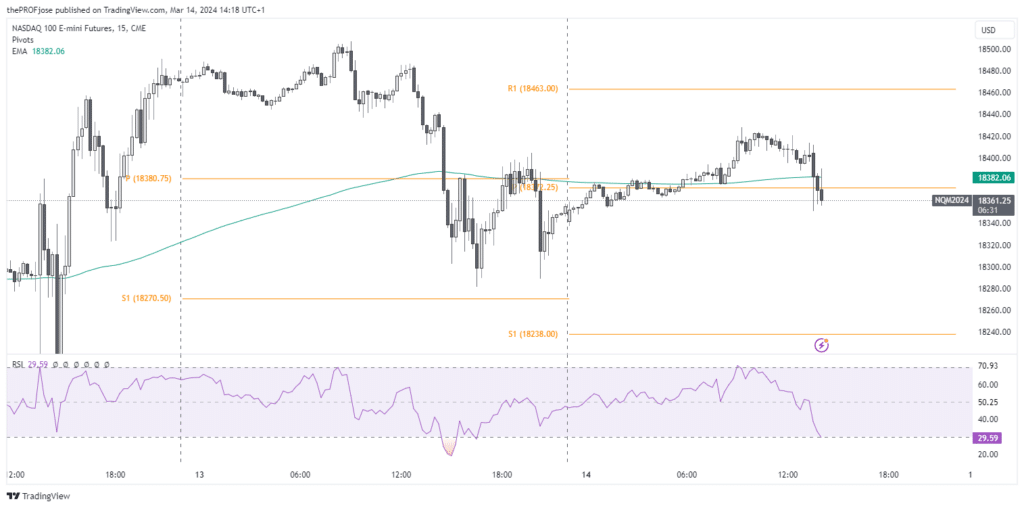
Specifically, the Relative Strength Index highlighted in the chart suggests that the price has reached an oversold level, implying limited potential for further bearish trends and hinting at an imminent reversal. This juxtaposition of indicators necessitates that short-term traders exercise caution, patiently observing how the price responds to other key levels before making decisions.
NASDAQ100 Fibonacci Key Price Levels 14/03/2024
The technical setup suggests a cautious approach as the index is testing critical support levels. In view of this, here are some critical support and resistance levels to pay attention to:
| Support | Resistance |
| 18370.92 | 18413.07 |
| 18382.57 | 18420.27 |
| 18389.77 | 18431.92 |
Risk Disclosure: The information provided in this article is not intended to give financial advice, recommend investments, guarantee profits, or shield you from losses. Our content is only for informational purposes and to help you understand the risks and complexity of these markets by providing objective analysis. Before trading, carefully consider your experience, financial goals, and risk tolerance. Trading involves significant potential for financial loss and isn't suitable for everyone.


