


The Dow Jones index futures chart is looking up ahead of key economic indicators today. This rally comes after Fed Chair Powell allayed stagflation concerns during the FOMC’s two-day meeting, which ended on Wednesday.
Key Points
- Stagflation fears were temporarily allayed after Fed Chair Powell stated the unlikelihood of further interest rate hikes.
- While the index takes a generally neutral outlook, according to popular indicators, critical economic data releases may introduce a clear bias.
- Key price levels are between 38,790 resistance and 37,860 support.
Dow Jones Daily Price Analysis – 03/05/2024
Dow Jones Futures rallies ahead of market open on Friday, trading at 0.80% and mimicking Thursday’s 0.82% gain.
This rally comes after Fed Chair Powell downplayed stagflation concerns on Wednesday, stating that it was more unlikely to get an interest rate hike than a cut at the next meeting. Also contributing to the rally is Apple’s strong earnings report and board approval of $110 billion in share repurchases.
This rally will, however, be put to the test when the employment reports (non-farm payrolls and unemployment rate) go public later today. Before those, we get the average earnings report. Then, the ISM Non-manufacturing PMI for the month of April takes the spotlight.
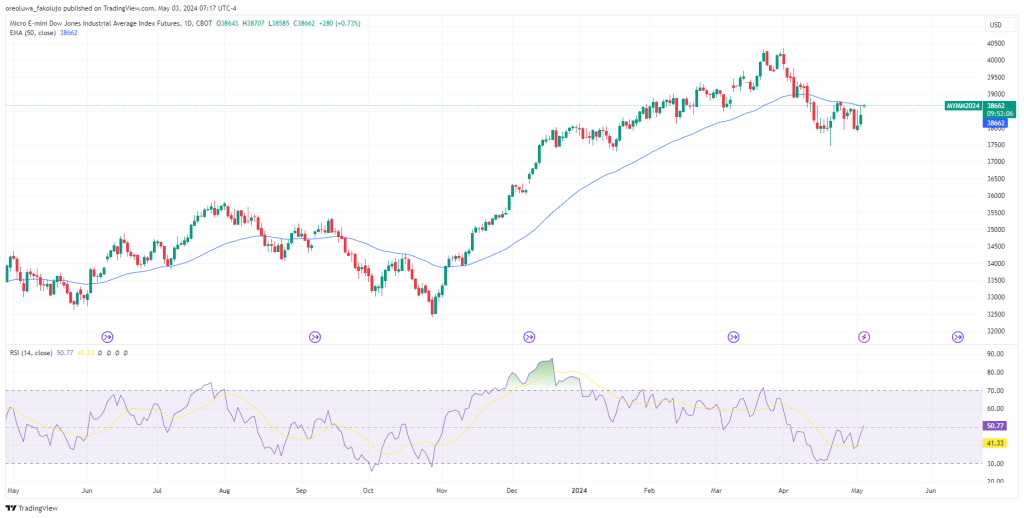
Despite the rally, the technical outlook for this index still looks slightly bearish according to the 50 EMA, as the moving average line hangs above price action. The RSI gives a rather neutral outlook, as the indicator line sits just at the midpoint.
Dow Jones Intraday Technical Analysis – 03/05/2024
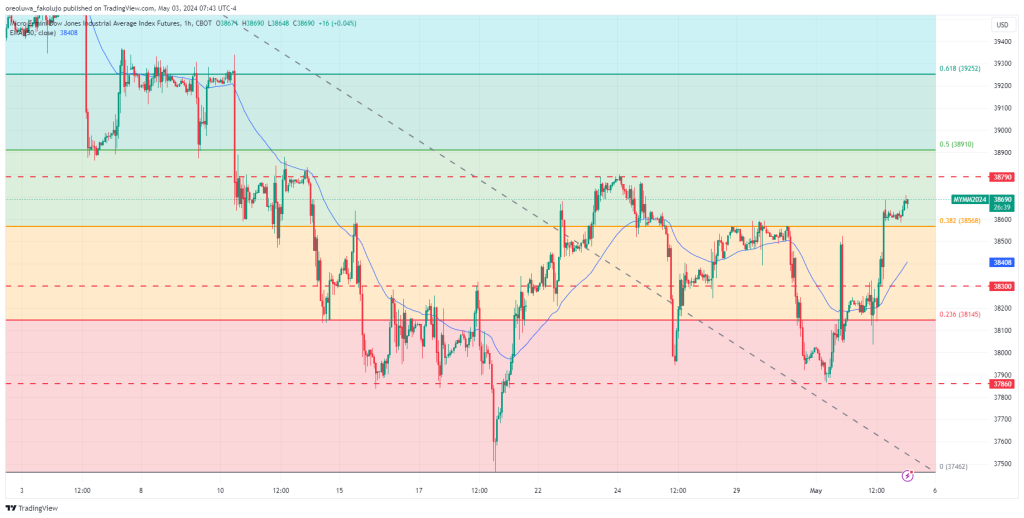
The hourly chart consolidates between 38,790 resistance and 37,860 support. In between these two levels is another key support level at 38,300. A break above or below these levels could determine the short-term direction of the index. For instance, if the price breaks below the 38,300 support, it may fall further to the 37,860 level. And if the price gets through the 38,790 resistance level, 38,910 becomes the next target.
The Fibonacci Retracement tool drawn from the 40,358 swing high to the 37,462 also provides us with more tradable levels. The closest to the price is the 0.382 (38,568) support. Should the price fall below this level, the 0.236 (38,145) fib level gets exposed. On the upside, we have the 0.5 (38,910), 0.618 (39,252), and 0.786 (39,738) resistance levels awaiting.
Key Economic Data and News to Be Released Today
Today is a busy day on the economic calendar. The first key data for the day is the average earnings report and the last key data will be the ISM Non-Manufacturing data. Sandwiched between these, the most anticipated report of the day will go public: employment data.
DJI Key Pivot Points – 03/05/2024
Based on the 1hr chart, the key Pivot Points for DJI are these:
| S2 | S1 | P | R1 | R2 |
| 37,749 | 38,065 | 38,352 | 38,668 | 38,955 |
Related Articles:
Risk Disclosure: The information provided in this article is not intended to give financial advice, recommend investments, guarantee profits, or shield you from losses. Our content is only for informational purposes and to help you understand the risks and complexity of these markets by providing objective analysis. Before trading, carefully consider your experience, financial goals, and risk tolerance. Trading involves significant potential for financial loss and isn't suitable for everyone.


