The DJI index rose for the 7th consecutive day on Thursday after the US unemployment claims came out worse than expected, signaling a slowing labor market. As a result, the clamor for Fed rate cuts has increased, bringing index prices up.
Key Points
- The slowing of the market steadily renews hopes for Fed rate cuts.
- According to key indicators, the index’s outlook has transitioned to bullish after a bearish start to Q2.
- Key price levels are between 39,252 resistance and 39,738 support.
Dow Jones Daily Price Analysis – 10/05/2024
Dow Jones index futures rose by another 0.83% to notch its 7th consecutive winning day. Before the market opening on Friday, it gained another 0.22%
This spirited move continued with the release of the United States Unemployment Claims Report, which came in way higher than expected on Thursday. This suggested that the labor market was cooling off, renewing the buzz for rate cuts.
The rally also had Fed Chair Powell’s comment that the next interest rate move was not likely to be a hike as a tailwind. Add that to the strong earnings reports, and you may see why investors are optimistic about the stock index.
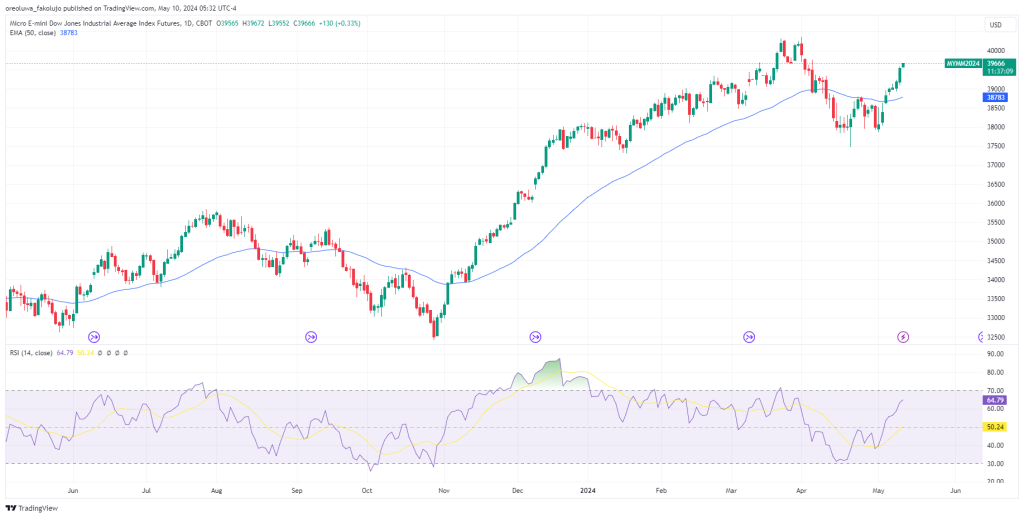
From a technical perspective, the price rose past the 50EMA line last Friday and hasn’t looked back since. The RSI has also risen farther into the bullish zone. Both indicators suggest a bullish outlook for the index.

Dow Jones Intraday Technical Analysis – 10/05/2024
The seven-day rally has given investors reasons to think bullish thoughts, but there’ll be doubts in the hearts of some others as the swing high of 40,358 looms above the price. Not only is this price a swing high, but it’s also an all-time high for the index futures.
Until we break beyond those levels, investors will still have reasons not to go full throttle on the index. But for now, the 0.786 (39,738) fib resistance level is the most imminent challenge for the price. Only after it gets past this level will it have the chance to challenge another resistance level at 40,102 and then the all-time high.
For support, the price has 0.5 (38,910), 0.382 (38,568), and 0.236 (38,145) Fibonacci levels.
Key Economic Data and News to be Released Today
Apart from the CFTC net positions today, investors will have their focus on the news-laden week coming next week, particularly the US inflation data.
DJI Key Pivot Point 10/05/2024
Based on the 1hr chart, the key Fibonacci Retracement levels for DJI are these:
| Support | Resistance |
| 38910 | 39252 |
| 38568 | 39738 |
| 38145 | |
| 37462 |
Risk Disclosure: The information provided in this article is not intended to give financial advice, recommend investments, guarantee profits, or shield you from losses. Our content is only for informational purposes and to help you understand the risks and complexity of these markets by providing objective analysis. Before trading, carefully consider your experience, financial goals, and risk tolerance. Trading involves significant potential for financial loss and isn't suitable for everyone.


