With conflicting price action signals and upcoming high-impact economic data, investors are curious to know if the uptrend will continue or if a reversal is around the corner.
Key Points
- The Dow made a marginal increase yesterday to continue trading around all-time levels. Dow Jones futures trade flat on Tuesday morning as investors wait for CPI data.
- While most technical indicators suggest an upward movement, the RSI gives conflicting signals.
- Investors await the release of major USD economic data today, expecting to get a clue on the market’s next move.
Dow Jones Daily Price Analysis – 12/03/2024
The Dow Jones experienced a relatively unstable trading day yesterday. The day started with the market price heading downward and hitting a low at 38,929.00, but it later took a quick turn, closing at 39,234.00, a slight increase from its open at 39,230.00, marking a modest gain of +0.08%.
The minimal difference between the open and close prices suggests a day of indecision, with neither bulls nor bears taking definitive control. Yet, the DJI is hovering around all-time highs, with all major US indices hitting record highs over the past month.
Today, the Dow has seen a slight uptick in activity. Opening at 39,266.00 and reaching a high of 39,306.00, the Dow has shown some resilience, with a current price of 39,290.00, translating to a +0.13% change. This early movement suggests a modestly optimistic outlook among traders, possibly reacting to pre-market expectations of the economic data to be released today or reflecting investors’ reaction to the weak NFP report that was released on Friday.
Key Economic Data and News to Be Released Today
The high-impact news scheduled for release today includes updates on the Core Consumer Price Index (CPI) and the CPI, both month-to-month and year-to-year, along with results from the 10-year Bond Auction. The Core CPI and CPI figures are crucial indicators of inflation, which the Federal Reserve closely monitors when making interest rate decisions.
With the forecast for the Core CPI m/m at 0.3%, up from the previous 0.4%, and the CPI m/m expected to rise to 0.4% from the previous 0.3%, there’s a mixed signal on the inflation front. The year-over-year CPI is expected to remain steady at 3.1%.
These inflation indicators can significantly affect market sentiment. Higher-than-expected inflation rates may fuel speculation about more aggressive monetary policy tightening by the Fed, potentially leading to downward pressure on stocks. Conversely, in-line or lower-than-expected figures could ease concerns about immediate interest rate hikes, supporting a bullish outlook for the Dow.
Dow Jones Technical Analysis – 12/03/2024
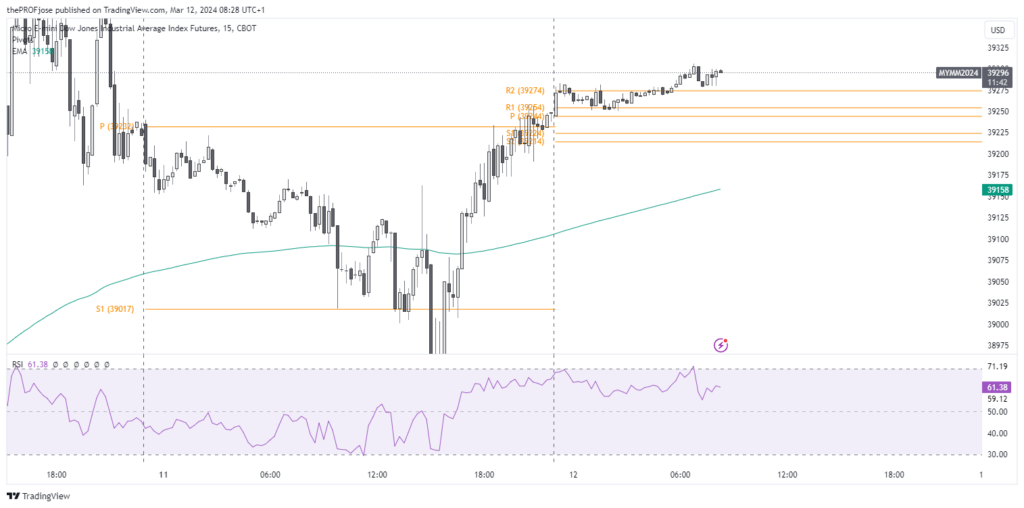
The 15-minute chart shows that the Dow has a complex market structure today. As you can see in the chart below, the price is trending above the intraday 200 EMA after going slightly below it yesterday.

A closer look at price interaction with the pivot point shows that the Dow is strongly bullish, breaking above resistance zones while respecting support levels. However, the RSI is positioned closely around the overbought area. In this case, traders may consider sitting on their hands while waiting for the upcoming high-impact news to clarify the next move.
Dow Jones Fibonacci Key Price Levels 12/03/2024
Short-term traders planning to invest in US 30 today should keep a close eye on the following key price levels for the day:
| Support | Resistance |
| 39265.00 | 39300.93 |
| 39274.93 | 39307.07 |
| 39281.07 | 39317.00 |
Risk Disclosure: The information provided in this article is not intended to give financial advice, recommend investments, guarantee profits, or shield you from losses. Our content is only for informational purposes and to help you understand the risks and complexity of these markets by providing objective analysis. Before trading, carefully consider your experience, financial goals, and risk tolerance. Trading involves significant potential for financial loss and isn't suitable for everyone.


