


Dow Jones has embarked on a purposeful march to the upside, hovering around all-time levels. However, eyes are on the US inflation reports tomorrow amidst rate-cut uncertainties.
Key Points
- Dow Jones ended the previous week on a high despite a losing Friday.
- All momentum seems to have left the index as investors await inflation reports tomorrow.
- There are key support and resistance levels between which the price is bouncing at the moment.
Dow Jones Previous Week Recap: 05/02/2024 – 09/02/2024
Dow Jones had an exciting week last week. It shed close to 0.5% on the first day of that week but rose by 1.17% from the lowest point of that day to finish the week on a high. This made it the 15th consecutive week of DJI, ending the week stronger than it had opened.
Today, following the bell, the Dow Jones 30 (DJI) inched up 0.15%, trading at 38,727, with all US indices muted ahead of crucial economic data releases this week, including the CPI data tomorrow.
Dow Jones Daily Price Analysis – 12/02/2024
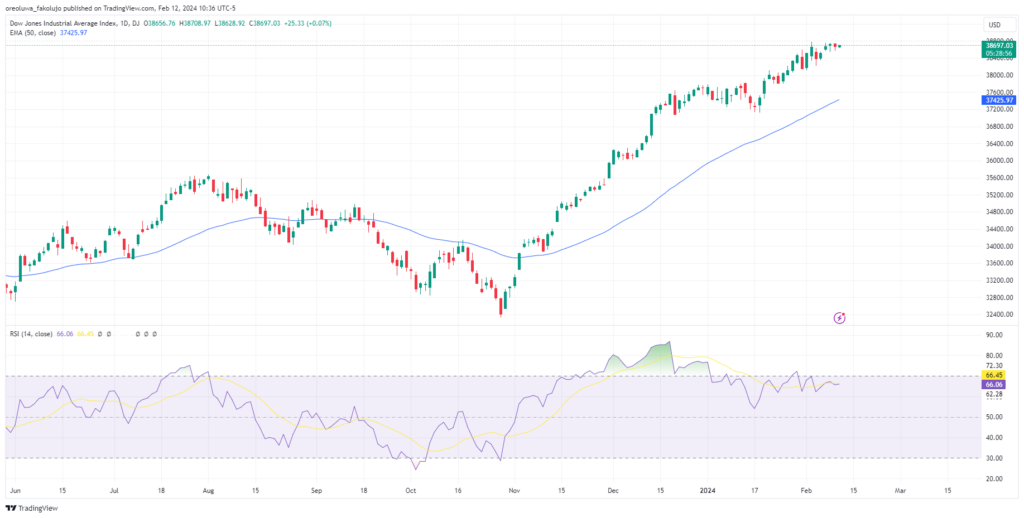
The last day of the previous week was a bearish day for the index. On Friday, it opened at $38,731.97, went as far down as $38,567.90, and closed at $38,671.70 for a 0.16% loss. However, this has done little to cause the overall bullish march to falter.
Today, the DJI has started on the positive side, with US markets muted ahead of key economic data expected to be released this week.
The price is far above the 50 EMA, and the RSI is strongly bullish. A strong pullback is long overdue, but there’s no telling when. There are some suggestions that the impending CPI reports may be the harbinger of this pullback. If the Fed keeps the interest rate steady or lower interest rate in March, Dow Jones will likely maintain its bullish charge.
Dow Jones Intraday Technical Analysis – 12/02/2024
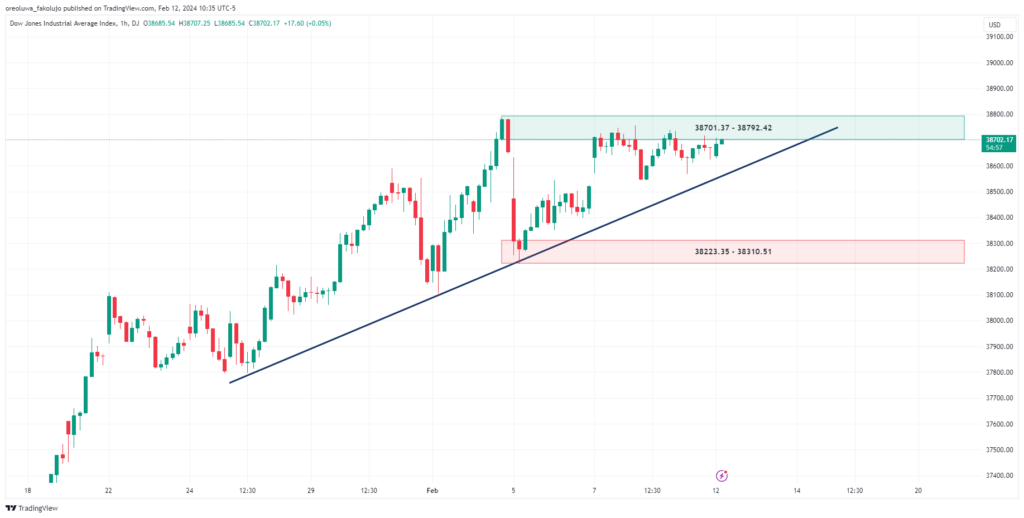
Technically, Dow Jones rests on a bullish trendline. On that line, multiple support zones have emerged. The closest to the price is $38,223.35 – $38,310.51. But to reach this zone, the price must first break out of its trendline. As of now, the chances of a continuation of the bullish trend are more likely.
Despite the market’s positive momentum, there may be a case for the bears. A resistance level hovers at the $38,701.37 – $38,792.42 zone. The price will continue to dangle between these two key levels until something stimulates it to break either. If this resistance level breaks, the next bullish wave is all but confirmed for DJI.
Key Economic Data and News to be Released Today
Everyone’s attention is on the release of the CPI reports tomorrow. In addition, we do have two Fed officials giving speeches in a few hours from now.
Dow Jones 30 Key Fibonacci Price Levels 12/02/2024
Based on the 1hr chart, the key Fibonacci price levels for US30 are these:
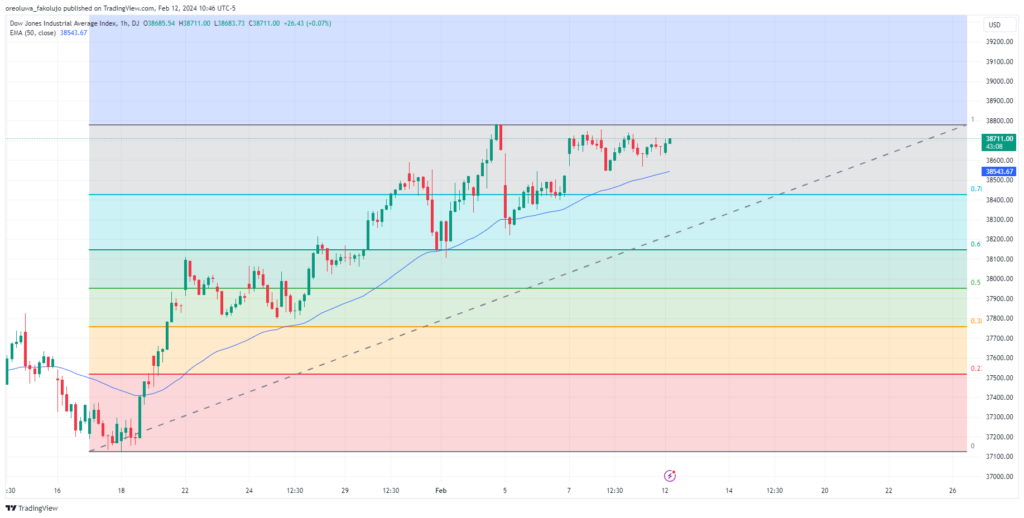
| Support | Resistance |
| $38,424.44 | $38,782.47 |
| $38,146.74 | |
| $37,951.39 |
Risk Disclosure: The information provided in this article is not intended to give financial advice, recommend investments, guarantee profits, or shield you from losses. Our content is only for informational purposes and to help you understand the risks and complexity of these markets by providing objective analysis. Before trading, carefully consider your experience, financial goals, and risk tolerance. Trading involves significant potential for financial loss and isn't suitable for everyone.


