


Despite a bearish Thursday for the pair, the outlook remains bullish for the USDJPY as the Japanese economy slips into recession.
Key Points
- USD/JPY price suffered a 0.48% drop on Thursday, but the pair looks to be quickly retracing its steps today.
- PPI and other key economic data may determine the ultimate order of the pair today.
- The $150.140 remains a crucial support level for the pair today.
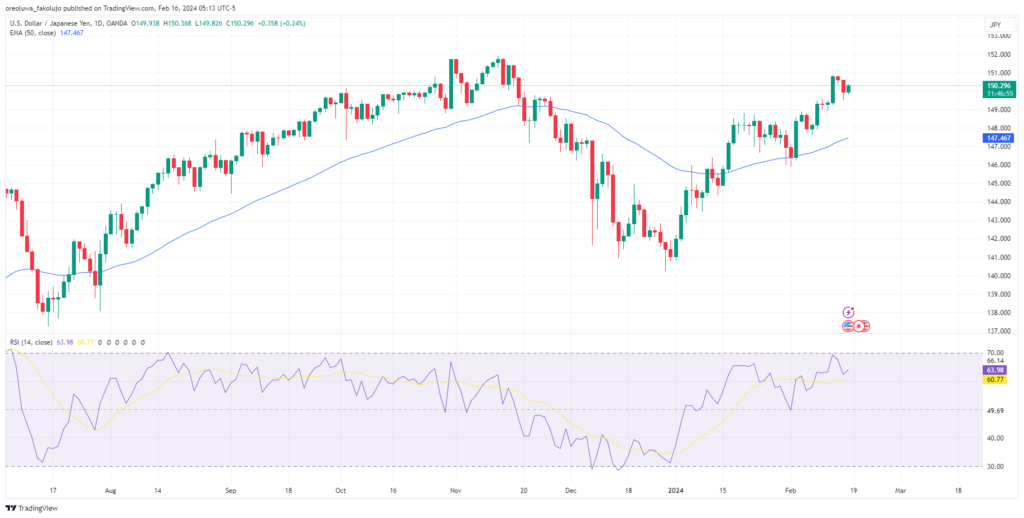
USD/JPY Daily Price Analysis – 16/02/2024
USD/JPY fell by 0.71% on Thursday, recuperated some of the losses, and finally closed at $149.938 for a loss of 0.48%. This move is likely to be a retracement from the robust uptrend of the pair following the CPI data on Tuesday. Today, with the USD/JPY already up by 0.19% to $150.229, there are signs that the retracement has ended, and according to most analysts, the major bullish outlook is likely to continue.
This drop yesterday came despite the negative economic updates from Japan. Japan’s economy has recently slipped into recession, and economists are questioning how long the Bank of Japan would sustain its loose monetary policies.
Technically, the RSI and the 50-EMA remain bullish, so we retain our bullish outlook for the pair today.
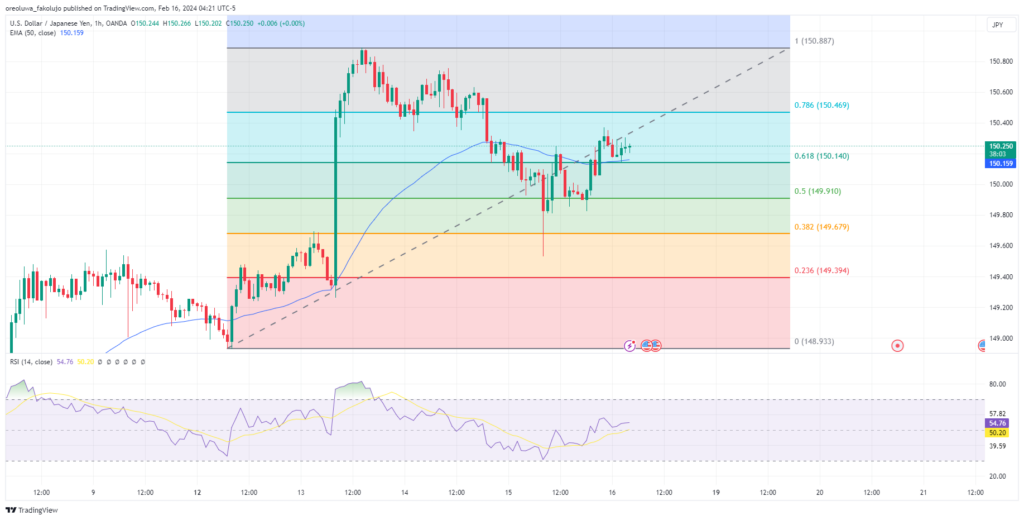
USD/JPY Intraday Technical Analysis – 16/02/2024
Every day since Tuesday’s CPI, the USD/JPY seems to be in a correction mode. Today, during the Asian session, the pair seems to have turned its retracement around, which bottomed out just below the 0.382 Fibonacci level at $149.531. In the same session, the RSI turned bullish, the price crossed the 50 EMA to the upside, and the MACD is printing green bars again. Notably, for price action traders, a new bullish market structure has emerged.
Yet, the USD/JPY is not completely out of the woods yet. The $150.140 price level is proving to be crucial for the pair, as the price is poised delicately above it as a support. If this level holds the price, we might see a bullish charge past the Asian session high of $150.369. From there, there are upper levels of $150.469 and the major swing high of $150.88.
On the other hand, if this support fails and the price falls below it, we might see further retracements back to $149.910, $149.679, or 149.394. Moreover, if the JPY suddenly starts to overpower the USD, we may see a complete invasion of the swing low sitting at $148.933.
Key Economic Data and News to Be Released Today
There are a lot of key news updates to look out for today. We have PPI news by 8:30 AM GMT-5. A higher-than-expected data could send the USD/JPY higher, while lower-than-expected data could give the JPY a chance to catch its breath and pause the bullish run.
We also have important speakers today, including an FOMC member and the release of CFTC speculative net positions on Gold, S&P 500, and crude oil. CFTC speculative net positions for the JPY are also expected to be published later on today.
USD/JPY Key Fibonacci Price Levels 16/02/2024
Based on the 1hr chart, the key Fibonacci price levels for USDJPY are these:
| Support | Resistance |
| $150.140 | $150.469 |
| $149.910 | $150.887 |
| $149.679 |
Risk Disclosure: The information provided in this article is not intended to give financial advice, recommend investments, guarantee profits, or shield you from losses. Our content is only for informational purposes and to help you understand the risks and complexity of these markets by providing objective analysis. Before trading, carefully consider your experience, financial goals, and risk tolerance. Trading involves significant potential for financial loss and isn't suitable for everyone.


