


Last week’s strongly bearish price movement wasn’t enough to force the price out of its bullish trend. This week, key interest-rate news releases from both sides of the Atlantic will determine market sentiment.
Key Points
- Despite a strong bearish price movement last week, the GBP/USD outlook still remains neutral/ bullish on the daily chart.
- This week, investors will be looking to key economic indicators from the BoE and the Fed for fresh directions
- As of writing, the price hovers above the key support level of $1.272.
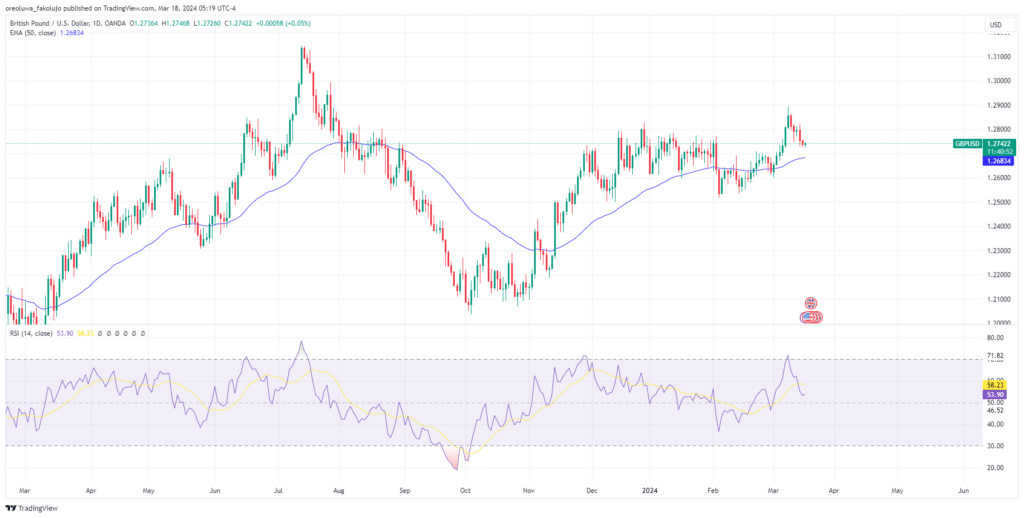
GBP/USD Daily Price Analysis – 18/03/2024
Last Friday, the GBP/USD lost 0.13% as the Greenback received a boost from Thursday’s positive US retail sales and a decline in domestic jobless claims. The pair trades at $1.27422 as of this writing, an uptick of 0.03%.
The general movement of the GBP/USD last week was bearish, as the USD kept showing signs of economic strength with each economic data release, potentially sustaining the Fed’s hawkish sentiment and keeping the Greenback strong. Conversely, its counterpart across the Atlantic showed less economic strength, creating expectations of an impending rate cut. Overall, the GBP/USD had lost 0.94% in the previous week.
A fresh outlook on market direction will be sought in this week’s economic events, with the BoE and Fed set to release key inflation data later this week. But as things stand on the technical horizon, the pair’s outlook remains bullish. The 50-EMA is beneath the price, and the RSI line is above the midpoint. However, investors are advised to approach with caution as the price is making a retracement toward the 50-EMA line and the midpoint of the RSI.
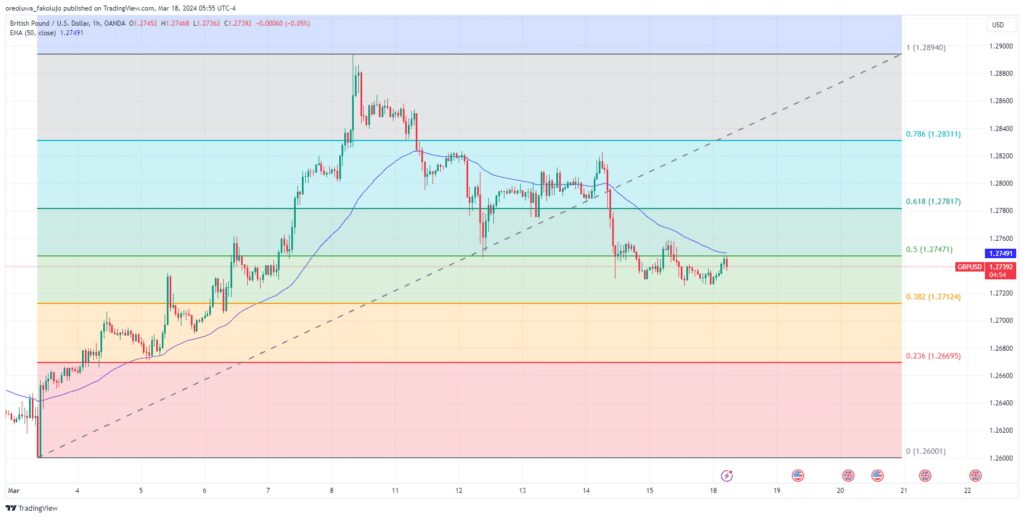
GBP/USD Technical Analysis – 18/03/2024
Technically, the slightly negative momentum of the GBP/USD last week seems to only be a retracement from the overall major bullishness of the price. To measure how much retracement the price has made, we plot the Fibonacci Retracement tool from the $1.26001 swing low to the $1.28940 swing high.
This reveals that the price is slightly beyond halfway deep into retracement. The 0.5 Fib level ($1.27471) now hangs above the price as the closest resistance level. And beneath the piece, we have the 0.382 Fib level ($1.27124). If this retracement continues, the 0.236 level ($1.26695) is the only Fib level keeping the price from approaching the swing low.
On the flip side, if the price crosses the 0.5 Fib level and then proceeds to cross over the 1.27600 psychological level, we may see a test of the 0.618 Fib level ($1.27817) or higher.
Key Economic Data and News to Be Released Today
Today is relatively free of high-impact news for the GBP and the USD. On Wednesday, though, the Core CPI reports in the UK will be published, and there will be an FOMC meeting. Then, the BoE interest rate decision is scheduled for Wednestdaay following by the US initial jobless claims report. Finally, on Friday, Fed Chair Powell will testify to reveal what’s the Fed plans in the next meeting..
Investors will look ahead to this week to gain fresh insights into the direction of each individual currency and the pair.
GBP/USD Key Fibonacci Price Levels 18/3/2024
Based on the 1hr chart, the key standard Fibonacci levels for the GBP/USD are these:
| Support | Resistance |
| $1.27124 | $1.27471 |
| $1.26695 | $1.27817 |
| $1.26001 | $1.28311 |
| $1.28940 |
Risk Disclosure: The information provided in this article is not intended to give financial advice, recommend investments, guarantee profits, or shield you from losses. Our content is only for informational purposes and to help you understand the risks and complexity of these markets by providing objective analysis. Before trading, carefully consider your experience, financial goals, and risk tolerance. Trading involves significant potential for financial loss and isn't suitable for everyone.


