


The GBP/USD pair faced significant pressure yesterday, continuing into today’s session. Economic data from the UK showed inflation holding at 4.0%, missing the forecasted figures. This, along with the higher-than-expected CPI data that was released yesterday, has led to bearish sentiment, with GBP/USD tumbling below the 1.2600 threshold.
Key Points
- UK inflation holds steady, disappointing market expectations.
- GBP/USD stumbles following UK CPI data, signaling bearish momentum.
- High-impact economic events and central bank speeches are on the horizon.
GBP/USD Daily Price Analysis – 14/02/2024
Yesterday, GBP/USD dropped by – 0.29%. The price action was characterized by a breach of the pivotal support level at 1.26179, followed by a further downward push past subsequent support levels. The market sentiment was significantly bearish, influenced by both technical resistance levels remaining unchallenged and stronger-than-expected USD CPI data. The day concluded with the pair registering a notable decrease in value.
Earlier today, the GBP/USD continued its descent, influenced by the release of the UK’s CPI data, which held steady at 4.0%, missing the analyst’s target of 4.1%. This had a dampening effect on the Pound, contributing to the pair’s decline. The day’s range so far has seen the pair moving from a high of 1.26111 to a low of 1.25362, indicating significant market activity and trader interest in the currency pair.
Key Economic Data and News to Be Released Today
The market’s response to the CPI figures in the US and the UK will be critical in shaping the GBP/USD pair’s trajectory. A steady inflation rate typically diminishes the urgency for central banks to raise interest rates, which could decrease the currency’s appeal to yield-seeking investors.
Today’s key economic release will, therefore, play a vital role in setting the tone for the Pound’s performance in the forex market, with potential implications for the currency’s short-term movements and the Bank of England’s forthcoming monetary policy decisions.
GBP/USD Technical Analysis – 14/02/2024
Every technical indicator is pointing to the pair’s further decline. Currently, the price is trending under the 200 EMA and is currently closing below the S1 support level.
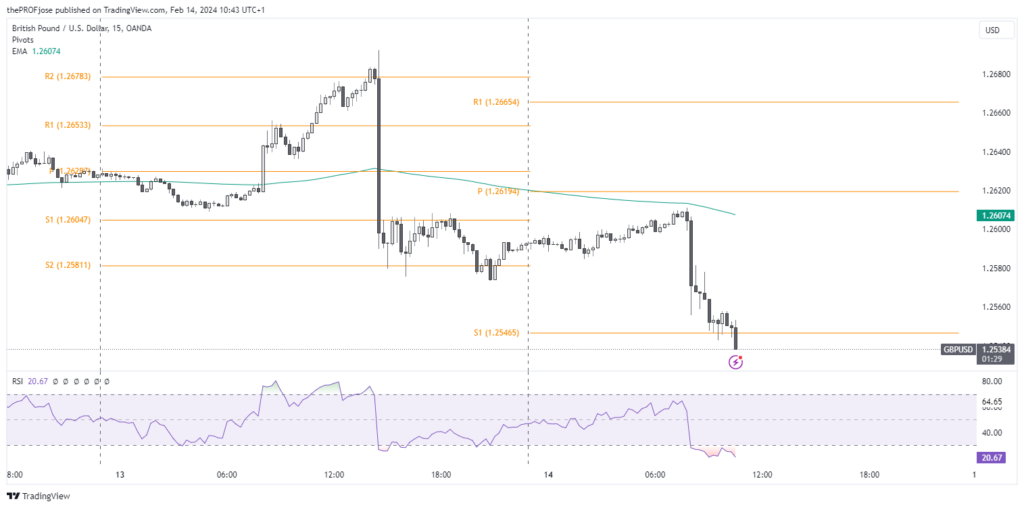
While we cannot clearly call what the market may do next, the RSI is suggesting that the price is currently oversold, and traders looking to sell the cable further should be careful as the price may turn any moment from now.
GBP/USD Fibonacci Key Price Levels 14/02/2024
Traders should keep a close eye on the following key price levels for the day:
| Support | Resistance |
| 1.2510 | 1.2552 |
| 1.2523 | 1.2565 |
| 1.2531 | 1.2573 |
Risk Disclosure: The information provided in this article is not intended to give financial advice, recommend investments, guarantee profits, or shield you from losses. Our content is only for informational purposes and to help you understand the risks and complexity of these markets by providing objective analysis. Before trading, carefully consider your experience, financial goals, and risk tolerance. Trading involves significant potential for financial loss and isn't suitable for everyone.


