Yesterday, the silver market experienced a minor pullback, closing at $27.97 per ounce, marking a 0.67% decrease, but today recovered slightly by 0.34% to trade at $27.9950. The market’s focus is now on upcoming U.S. economic data, particularly the Core Producer Price Index for March.
Key Points
- Silver’s price slightly recovered today to $27.9950 after a minor pullback yesterday.
- Adjusted expectations for a Fed rate cut from June to September were influenced by recent economic data.
- Silver’s industrial demand, inflation hedge role, and geopolitical tensions could support its price.
Silver Daily Price Analysis – 11/04/2024
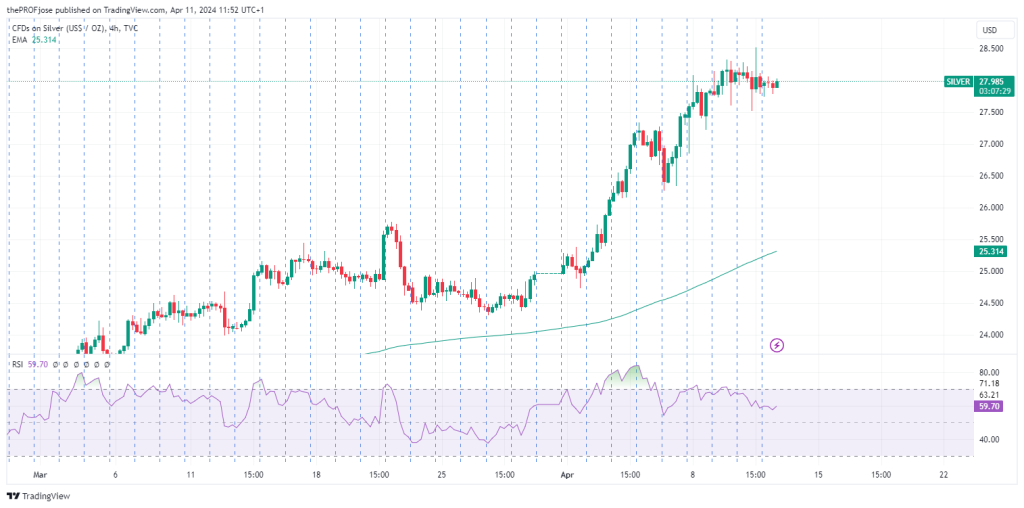
Yesterday, the silver market witnessed a minor pullback, closing at $27.97 per ounce, down by 0.67%, after reaching a peak not seen since June 2021. Today’s session saw a slight recovery, with silver inching up to $27.9950, a 0.34% increase from its open at $27.9015. This reflects cautious trading amid economic indicators that challenge the Federal Reserve’s inflation stance.
Recent economic data, including higher-than-expected consumer prices and a strong U.S. jobs report, have stirred doubts about potential interest rate cuts within the year. This sentiment was exacerbated by hotter-than-expected U.S. inflation data, leading traders to push back expectations for a Fed rate cut from June to September. Such expectations dampen the allure of silver, as higher interest rates make non-interest-bearing assets like precious metals less attractive.
However, on the other side, factors such as rising industrial demand for silver, its status as an inflation hedge, and geopolitical tensions in the Middle East might support its price. Currently, XAG/USD is trading at its highest level since 2020. If the rally continues, silver might test $29, with its next target at the previous peak in 2020 of $29.74.
Key Economic Data and News to Be Released Today
The market’s focus will shift to the forthcoming U.S. economic data releases, particularly the Core Producer Price Index (PPI) for March, which is anticipated to show a month-over-month increase of 0.2%, down from the previous 0.3%. These figures, along with key speeches from FOMC members, will be closely watched for further insights into the Fed’s policy direction.
As traders and investors digest these developments, the silver market will likely continue to respond to shifts in monetary policy expectations, inflation data, and geopolitical events, all of which could influence the metal’s price trajectory in the near term.
Silver Technical Analysis – 11/04/2024
On higher timeframes, silver shows a bullish trend, with its price maintaining a position above the 200 EMA. This indicates that, over the long term, investors are bullish about the value of silver, and its price trajectory has been upwards.

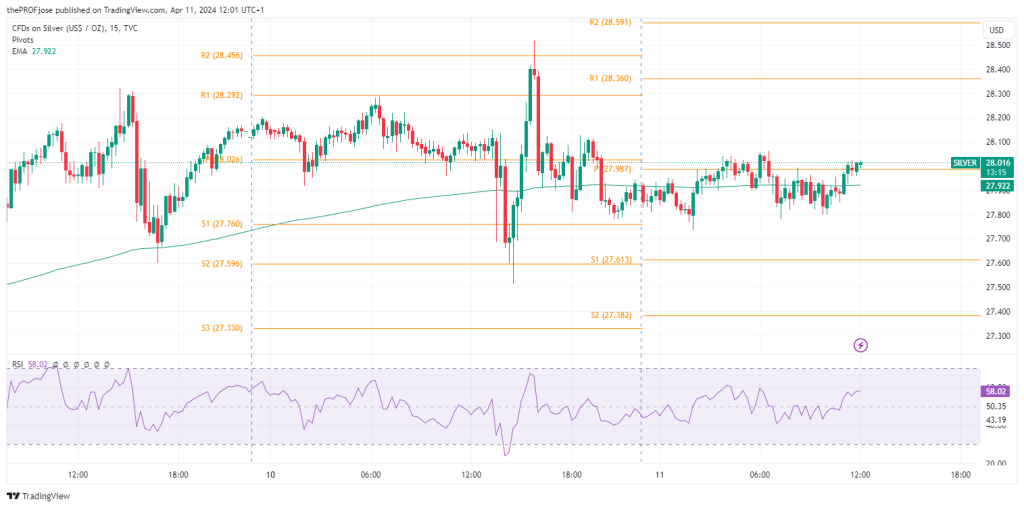
On the M15 timeframe, the price of silver is observed to be in a crucial position, closely interacting with the 200 EMA and the pivot point. A decisive movement and closure above the pivot point could be interpreted as a bullish signal. Traders might see this as an opportunity to enter long positions, aiming for gains up to the nearest resistance level.

Conversely, if the price closes below the S1 (27.3160) key level, this would indicate a short-term shift toward bearish sentiment.
Silver Fibonacci Key Price Levels 11/04/2024
Short-term traders planning to invest in Silver today should keep a close eye on the following key price levels for the day:
| Support | Resistance |
| 27.6130 | 28.3600 |
| 27.3820 | 28.5910 |
| 27.0070 | 28.9650 |
Risk Disclosure: The information provided in this article is not intended to give financial advice, recommend investments, guarantee profits, or shield you from losses. Our content is only for informational purposes and to help you understand the risks and complexity of these markets by providing objective analysis. Before trading, carefully consider your experience, financial goals, and risk tolerance. Trading involves significant potential for financial loss and isn't suitable for everyone.


