


The Natural Gas market saw tumultuous trading yesterday, indicating traders’ mixed responses to shifting economic signals. Today’s early sessions continued downward, with the market hinting at a bearish undertone. However, traders are expecting the EIA report to change the price direction to the upside.
Key Points
- Yesterday’s Natural Gas futures showed signs of overbought conditions.
- Today’s market activity leans bearish, with NG prices dropping -3.47%.
- Upcoming EIA storage data is expected to impact market volatility.
Natural Gas Daily Price Analysis – 22/02/2024
After the price broke out of the range on Tuesday, it has been spiking to the upside. Yesterday, in particular, NG price saw an impressive 12.50% gain due to an announcement by Chesapeake Energy regarding their decision to reduce production in 2024, a move prompted by the current low prices of natural gas. Although the bullish move was impressive, the price failed to break above major resistance and started tumbling downward, closing at 1.773.
Earlier today, the market opened with natural gas trading at 1.758, a slight decline from the previous close of 1.773. The day has witnessed a significant drop, with price currently at 1.710, a whopping -3.47% change from the opening price. The market is currently responding to the strong U.S. GDP growth, which is generally bullish for natural gas. However, high U.S. interest rates exert bearish pressure, complicating the market outlook.
Key Economic Data and News to Be Released Today
Traders are preparing for the release of today’s Energy Information Administration (EIA) storage report. The market consensus anticipates a reduction of about -64 billion cubic feet (Bcf) in natural gas storage, compared to the last report’s decrease of -49 Bcf.
The EIA storage report provides data on the amount of natural gas held in storage, which is a key indicator of supply and demand dynamics. A draw (or reduction) in storage typically indicates that demand is outpacing supply. In this case, the expected draw of -64 Bcf, which is larger than the previous -49 Bcf, suggests an increased demand or decreased supply of natural gas. This could lead to higher natural gas prices, as less available supply in the face of steady or increasing demand tends to push prices up.
Natural Gas Technical Analysis – 22/02/2024
Natural Gas futures exhibited a dynamic range yesterday, starting the session with a strong upward momentum. The price action tested the first resistance (R1) at 1.688 MMBtu but failed to sustain these highs, indicating a potential overbought scenario, which eventually led to a retracement towards the pivot point (P) at 1.747 MMBtu today. Despite the pullback, the market closed the day off its lows, hinting at underlying buying interest at lower levels.
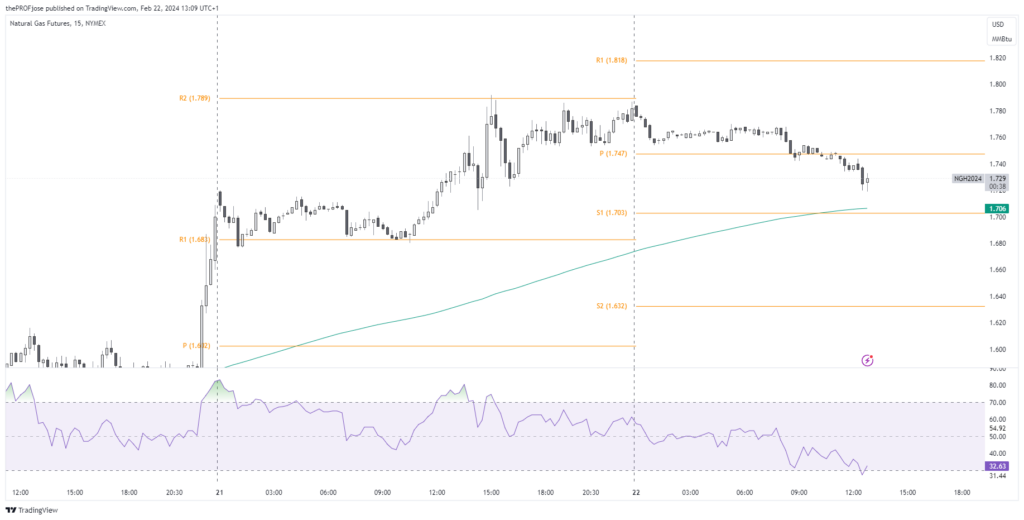
Currently, Natural Gas trades near the first support level, with the RSI pointing towards the oversold territory. This could attract buying interest, but caution is warranted as breaking below S1 could lead to further declines, with the next support (S2) at 1.632 MMBtu lying in wait. On the upside, a move back above the pivot point could reinvigorate bullish sentiment.
Natural Gas Fibonacci Key Price Levels 22/02/2024
Short-term traders planning to invest in NG today should keep a close eye on the following key price levels for the day:
| Support | Resistance |
| 1.736 | 1.752 |
| 1.740 | 1.756 |
| 1.744 | 1.760 |
Risk Disclosure: The information provided in this article is not intended to give financial advice, recommend investments, guarantee profits, or shield you from losses. Our content is only for informational purposes and to help you understand the risks and complexity of these markets by providing objective analysis. Before trading, carefully consider your experience, financial goals, and risk tolerance. Trading involves significant potential for financial loss and isn't suitable for everyone.


