


The short-term outlook for U.S. natural gas prices is bearish due to adequate supply levels amidst reduced production and broader energy market trends, despite the market showing resilience with modest price gains.
Key Points
- Production dropped to 99.1 bcfd in April, and maintenance activities spiked volatility.
- Warmer weather, power outages, and solar eclipse dampen demand amidst stable Asian LNG prices.
- Technical analysis suggests short-term selling, with prices overbought and facing key resistance.
Natural Gas Daily Price Analysis – 09/04/2024
Yesterday’s price action was influenced by a confluence of factors, notably the anticipated reduction in natural gas production. With the average output in the Lower 48 states dropping to 99.1 billion cubic feet per day (bcfd) in April due to a decrease in active gas rigs—especially in the Haynesville shale region—market participants have adjusted their expectations. This downturn in production, compounded by maintenance activities on critical pipelines, has introduced a level of volatility into the pricing mechanism.
Furthermore, the weather forecast pointing towards warmer conditions could lead to a decline in heating-related gas consumption. The market is also digesting the potential impacts of power outages in the Northeast and the effects of a solar eclipse on solar generation, both of which could momentarily reduce demand. These factors, alongside stable Asian LNG spot prices and the prospect of an active Atlantic hurricane season, contribute to the market’s complex dynamics.
As of now, the short-term outlook for U.S. natural gas prices appears bearish, given the adequate supply levels amidst reduced production, the warmer weather outlook, and broader energy market trends. The market’s resilience, seen in the modest price gains, reflects a careful balancing act between immediate demand-supply dynamics and longer-term production expectations.
Key Economic Data and News to Be Released Today
Although there are no high-impact economic activities today, traders should closely monitor high-impact economic data releases and global energy dynamics for cues on potential price movements.
The energy market is at a critical juncture where geopolitical events, changes in consumption patterns, and environmental factors could significantly sway prices. As such, investors are advised to stay abreast of developments in these areas, as they could have profound implications for natural gas prices in the coming days.
Natural Gas Technical Analysis – 09/04/2024
Currently, the price movement is observed to be trending above the 200 Exponential Moving Average . However, adding a layer of complexity to this optimistic view is the RSI, which points towards an overbought condition.
The interplay between these two indicators—price trending above the 200 EMA and the overbought RSI—provides a nuanced perspective on the current state of natural gas prices.
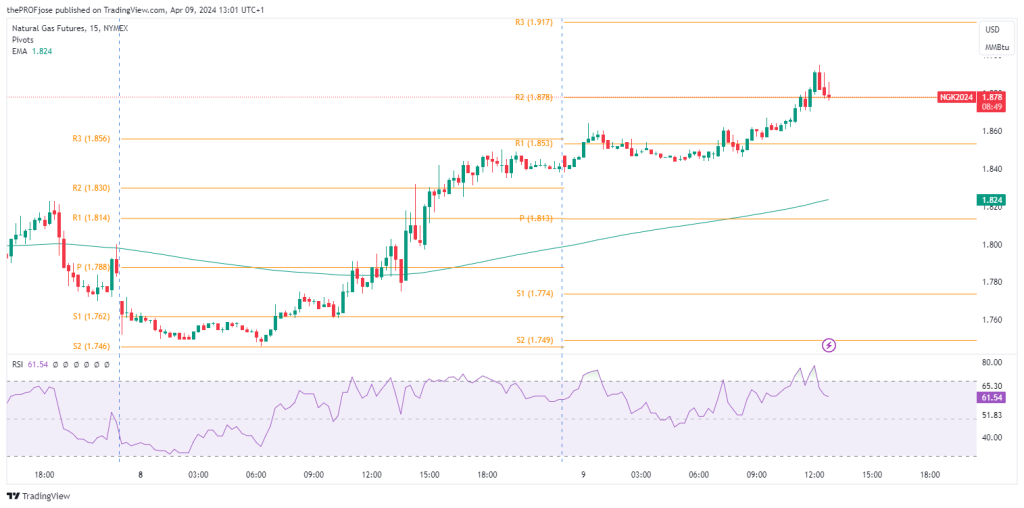
Natural Gas price is currently reacting to a key resistance level, which serves as a critical junction for traders. The reaction to this resistance level, coupled with the overbought conditions signaled by the RSI, suggests that we may see short-term selling pressure emerging in the market.
In the immediate future, the outlook for natural gas prices could lean towards a bearish sentiment, at least in the short term.
Natural Gas Fibonacci Key Price Levels 09/04/2024
Short-term traders planning to trade NG today should keep a close eye on the following key price levels for the day:
| Support | Resistance |
| 1.774 | 1.853 |
| 1.749 | 1.878 |
| 1.709 | 1.917 |
Risk Disclosure: The information provided in this article is not intended to give financial advice, recommend investments, guarantee profits, or shield you from losses. Our content is only for informational purposes and to help you understand the risks and complexity of these markets by providing objective analysis. Before trading, carefully consider your experience, financial goals, and risk tolerance. Trading involves significant potential for financial loss and isn't suitable for everyone.


