Today’s trading mirrors yesterday’s positive trend, albeit at a slower pace, indicating cautious optimism among traders for Natural Gas. A decisive break above the 1.900 resistance level could significantly strengthen the bullish trend, possibly pushing prices towards the 2.000 mark.
Key Points
- Natural gas prices increased modestly yesterday and today, suggesting short-term fluctuations in demand and supply are influencing the market.
- Technical analysis shows natural gas in a short-term bullish trend, with potential for further price appreciation if it breaks above the 1.900 level.
- Economic indicators and Fed communications today could impact the strength of the USD, affecting global natural gas demand and pricing.
Natural Gas Daily Price Analysis – 03/04/2024
Natural gas prices saw a modest increase yesterday, closing at 1.862, a 1.36% change from the open price of 1.837. This upward movement was amidst a trading day that observed a high of 1.881 and a low of 1.778. The gains were primarily driven by short-term fluctuations in demand and supply metrics.
Today’s trading session has so far mirrored this positive trend, albeit at a slower pace. The commodity opened at 1.853 and reached a high of 1.878, with a low of 1.844, marking a current price of 1.872. This represents a 0.54% increase from the opening, which can be largely attributed to cold weather forecasts. All in all, NG prices are entering an upward movement after a long period of downward pressure.
The market dynamics for natural gas are currently influenced by several key factors. ANZ Bank’s recent note highlighted a reversal in global natural gas prices, attributed to signs of slowing demand. This includes reduced natural gas storage withdrawals across Europe, suggesting temporary ease in demand pressures. However, the landscape is complicated by rising demand for liquefied natural gas (LNG) from Asia. In addition, colder weather forecasts and production cuts push NG prices higher.
North Asian LNG markets, particularly in emerging economies, are also showing increased buyer activity. Despite this, the high price level at US$9 per million British thermal units is deemed prohibitive for a significant uptick in purchases, potentially capping further price rallies in the short term.
Considering the above, traders should closely monitor developments in both European and Asian markets. The tug-of-war between easing demand in Europe and rising demand in Asia, especially for LNG, will play a crucial role in shaping price movements.
Natural Gas Technical Analysis – 03/04/2024
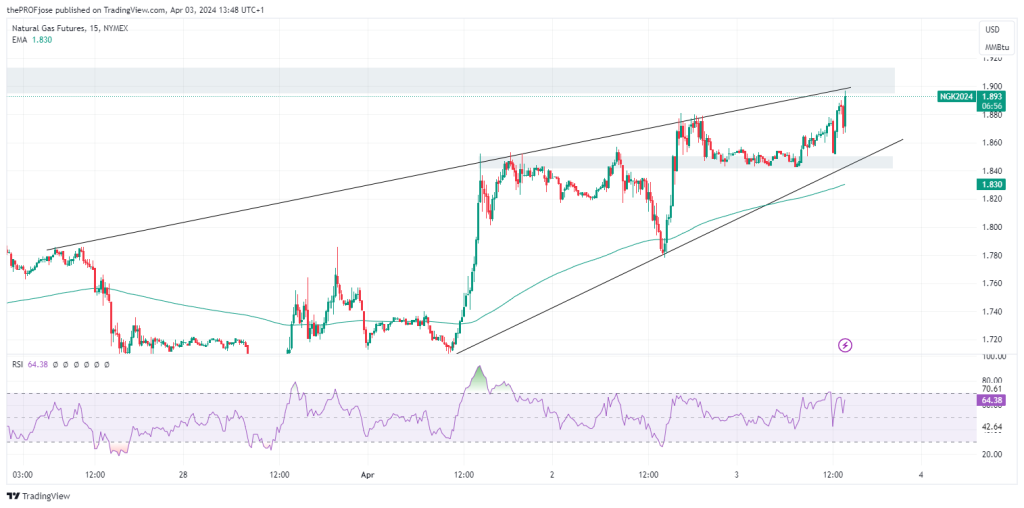
Technically, natural gas is showcasing promising bullish momentum within a defined upward channel. The current price trend above the 200 Exponential Moving Average.
Moreover, the RSI indicates there is still potential for upward movement before the asset reaches overbought territory. This suggests that, despite recent gains, Natural Gas has not yet hit the upper extremes of buying pressure, leaving room for further appreciation in price.

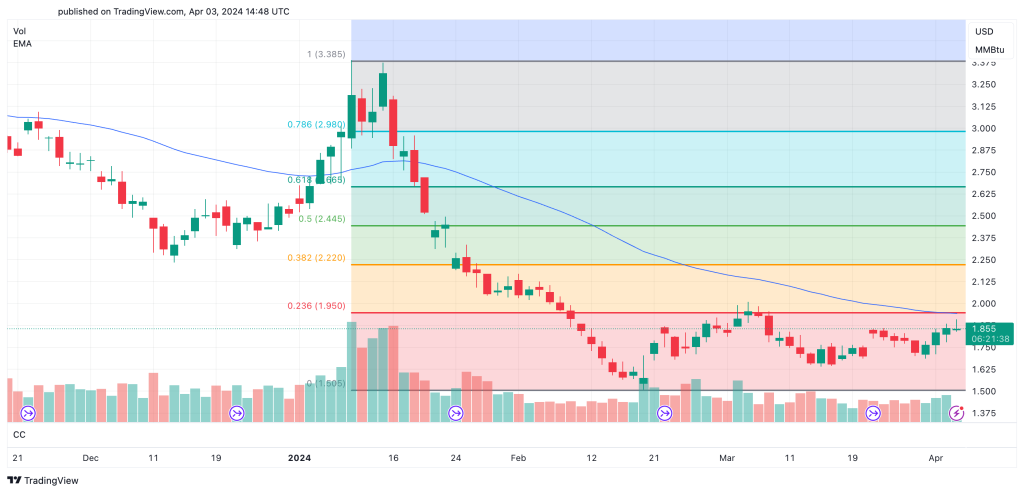
A particularly significant level to watch in the immediate future is the 1.900 mark. A decisive break above this key resistance level could serve as a catalyst for an intensified bullish trend, potentially propelling prices toward the 1.95 and then 2.000 threshold. Such a movement could attract additional buying interest, further fueling the ascent to the next Fibonacci level of 2.22.

On the downside, forecasts of warmer weather, high storage, and the NFP report may push NG prices lower. If that happens, the next support levels lie at 1.87, 1.825, and 1.785.
Natural Gas Fibonacci Key Price Levels 03/04/2024
Short and long-term traders planning trade NG today should keep a close eye on the following key price levels:
| Support | Resistance |
| 1.65 | 1.93 |
| 1.735 | 2.005 |
| 1.785 | 2.22 |
| 1.825 | |
| 1.87 |
Risk Disclosure: The information provided in this article is not intended to give financial advice, recommend investments, guarantee profits, or shield you from losses. Our content is only for informational purposes and to help you understand the risks and complexity of these markets by providing objective analysis. Before trading, carefully consider your experience, financial goals, and risk tolerance. Trading involves significant potential for financial loss and isn't suitable for everyone.


