


Ongoing geopolitical issues, including the deaths of key Iranian and Saudi leaders and concerns over Russian gas flows through Ukraine, add unpredictability to the Natural Gas market.
Key Points
- Natural Gas surged 5.25% on Friday due to a smaller-than-expected inventory rise. Today, NG futures added 1.56%, trading at $2.667.
- Dry gas production dropped 1.5% year-over-year, while demand decreased by 4.0%.
- Speeches by Fed officials Bostic, Barr, Waller, and Jefferson could influence energy demand.
Natural Gas Daily Price Analysis – 20/05/2024
Natural Gas experienced a significant rally on Friday, closing at $2.7460, a 5.25% increase from its open price of $2.6190. This surge was driven by a combination of factors, including a smaller-than-expected rise in natural gas inventories reported by the EIA. The inventories increased by 70 billion cubic feet, below the anticipated 76 billion cubic feet, easing oversupply concerns ahead of the summer months.
Additionally, the shutdown of one of the production units at the Freeport LNG export terminal in Texas due to previous damage, which limited export capacity, also contributed to the market’s tightness.
Today, Natural Gas opened at $2.7750 and has seen a slight increase, trading at $2.7800, up 0.72%. The continued upward momentum reflects ongoing bullish sentiment in the market, likely influenced by recent data showing reduced dry gas production and lower demand in the Lower-48 states. Dry gas production was reported at 99.4 billion cubic feet per day, a 1.5% year-over-year decrease, while demand stood at 65.5 billion cubic feet per day, down 4.0% year-over-year.
Key Economic Data and News to Be Released Today
Speeches by Federal Reserve officials, including Fed Bostic, Barr, Waller, and Jefferson, may provide insights into future economic policies that could affect energy demand.
Additionally, the ongoing geopolitical uncertainties, including the recent deaths of key Iranian and Saudi leaders and concerns over Russian gas flows through Ukraine, add a layer of unpredictability to the market.
Natural Gas Technical Analysis – 20/05/2024
Although the price is smoothly trending above the 200 EMA, the RSI is clearly overbought. That implies that although NG is bullish in the long term, we might experience some retracement or deeper pullback in the short term.
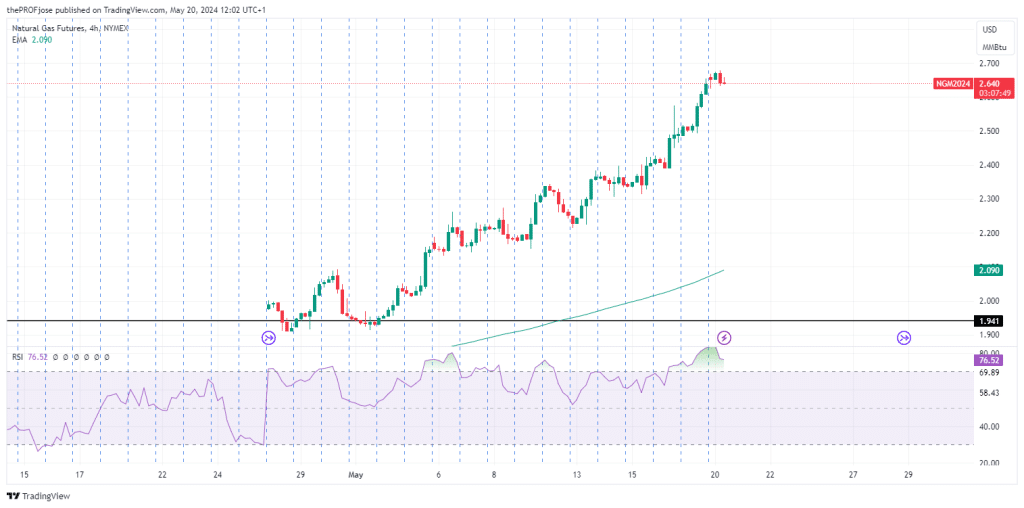
So, for intraday traders looking to enter a position, it’s important to wait for the price to align with the higher timeframe. So, a close below the 200 EMA is the optimum entry point for traders looking to enter a short trade.
While a long trade might not be likely given the current higher timeframe narratives, traders looking for buy setups might want to consider a close above the high of the day before buying.
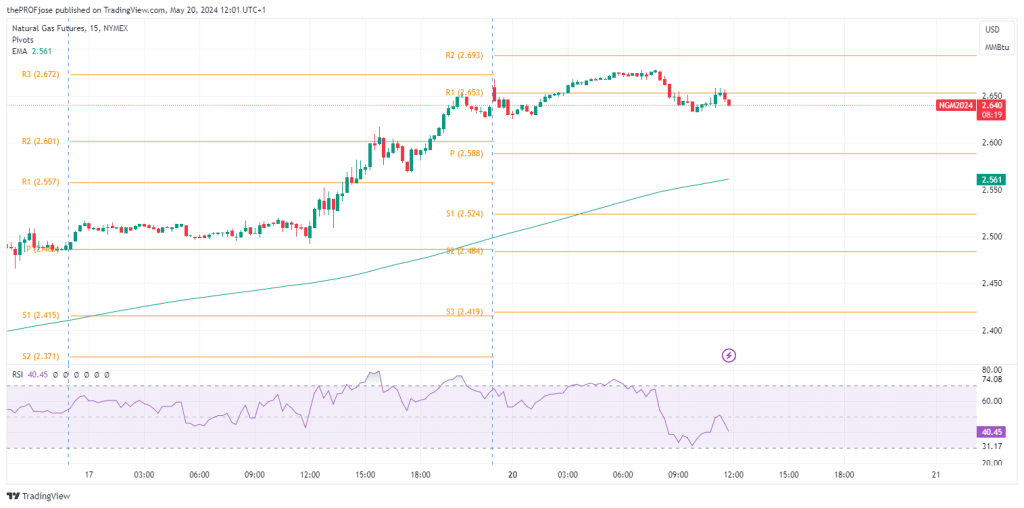
Natural Gas Fibonacci Key Price Levels – 20/05/2024
Short-term traders planning to invest in NG today should keep a close eye on the following key price levels for the day:
| Support | Resistance |
| 2.524 | 2.653 |
| 2.484 | 2.693 |
| 2.419 | 2.757 |
Risk Disclosure: The information provided in this article is not intended to give financial advice, recommend investments, guarantee profits, or shield you from losses. Our content is only for informational purposes and to help you understand the risks and complexity of these markets by providing objective analysis. Before trading, carefully consider your experience, financial goals, and risk tolerance. Trading involves significant potential for financial loss and isn't suitable for everyone.


