


In the week that just ended, the Natural Gas market witnessed a notable downtrend, with the Henry Hub spot price dropping to its lowest since June 2023. However, with forecasts suggesting a warmer climate ahead, will we see a change in market dynamics?
Key Points
- Henry Hub Natural Gas spot price dipped to its lowest since June 2023, influenced by warmer weather expectations.
- Inventory reports indicated a higher-than-expected increase, yet prices edged slightly upward.
- Economic calendar events remain light on high-impact data for natural gas today.
Natural Gas Daily Price Analysis – 12/02/2024
Last week, the natural gas market experienced significant shifts in pricing, as seen in the recent chart and market reports. The Henry Hub spot price, a key reference point for natural gas prices, dropped by 26 cents, from $2.23 per million British thermal units (MMBtu) to $1.97/MMBtu. This marked the lowest level since June of the previous year.
The downward trend was echoed across various locations, especially in the Northeast region, largely due to expectations of milder weather, which typically leads to a reduced need for heating. A notable example of this trend was the Algonquin Citygate price, which caters to the Boston area, falling by $1.01/MMBtu.
As of this writing, the trading price for Natural Gas was around $1.8250 per million British thermal units (MMBtu), marking a slight decrease of -1.19% from its previous closing value. During the day’s trading, prices fluctuated within a range of $1.786 to $1.8400/MMBtu.
Key Economic Data and News to Be Released Today
No specific high-impact news events that are directly related to natural gas for today have been listed. However, broader economic indicators such as GDP growth rates, CPI, and interest rates can indirectly impact natural gas prices.
Natural Gas Technical Analysis – 12/02/2024
Natural gas traders are closely monitoring the short-term technical setup, where the Fibonacci retracement levels on a 15-minute chart provide insights into potential support and resistance zones. The focus remains on whether the commodity will sustain its resilience or if the bearish pressure will return.
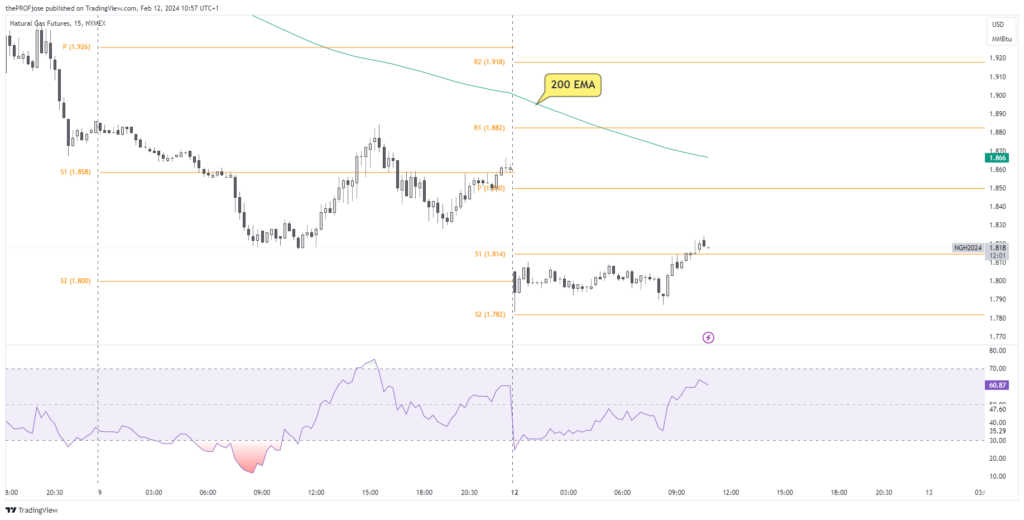
From the chart above, we can see that although the price is still trending under the 200 EMA, the RSI suggests that there’s still more room for upward movement, at least to the key resistance levels. If the price holds above the 1.814 level, the next price targets are at 1.85, and 1.88. Otherwise, NG price can drop to 1.782.
Natural Gas Fibonacci Key Price Levels 12/02/2024
In such a scenario as this, where the NG price is struggling between buying and selling, traders should pay close attention to price activity on the following support and resistance levels:
| Support | Resistance |
| 1.822 | 1.842 |
| 1.830 | 1.846 |
| 1.834 | 1.854 |
Risk Disclosure: The information provided in this article is not intended to give financial advice, recommend investments, guarantee profits, or shield you from losses. Our content is only for informational purposes and to help you understand the risks and complexity of these markets by providing objective analysis. Before trading, carefully consider your experience, financial goals, and risk tolerance. Trading involves significant potential for financial loss and isn't suitable for everyone.


