Key Points
- Weather patterns are driving natural gas (NG) demand as dependence on gas-fired electricity grows.
- NOAA estimates that there is a 99% that 2024 will be one of the top five warmest years on record.
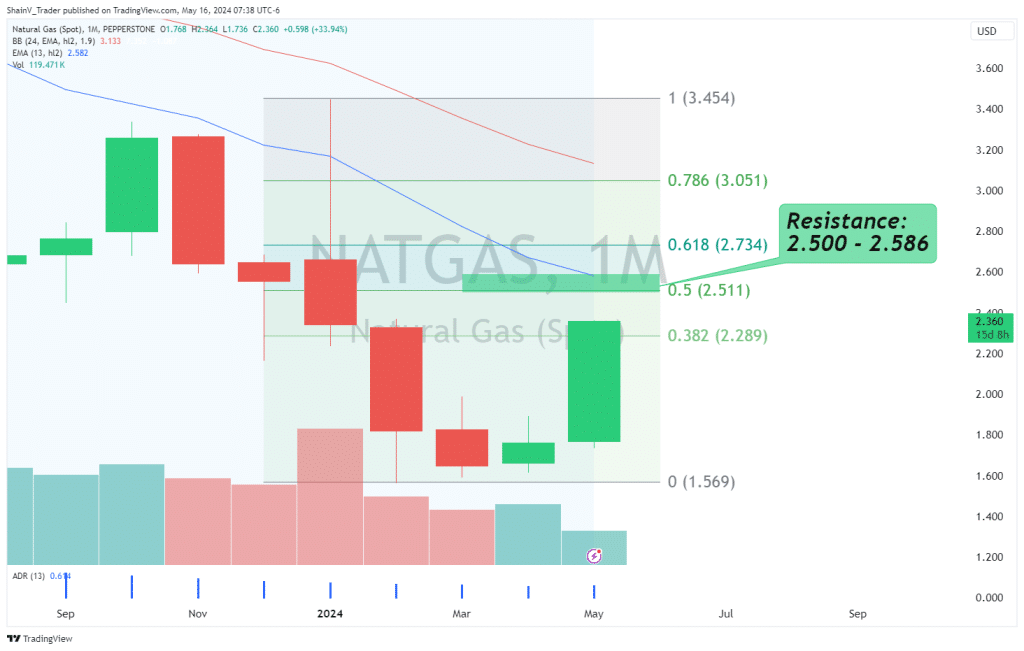
- The 2.500 area is a key technical resistance zone for NG.
May has been a banner month for natural gas (NG). Prices are up by more than 30% on increased demand and future projected demand. Last week, we wrote about how the artificial intelligence (AI) boom is one culprit for rising electricity requirements and natural gas consumption. Now, several reports have surfaced that illustrate that the use of NG for electricity production is already on the move.
Is natural gas undervalued or overvalued? The long-term trend for NG remains bearish; but, May has changed many traders’ minds. If the recent bidding persists, then gas may be headed much higher in the near term.
Weather Drives Demand
Weather always plays a big part in NG demand and consumption. In the Northern Hemisphere, winter is traditionally the most important season for natural gas use. However, summer is quickly catching up as more people need electricity to cool their homes and businesses.
This week, the EIA released data that shows natural gas-fired electricity creation set a winter record in Texas (USA). In a January cold snap, the Electric Reliability Council of Texas (ERCOT) recorded all-time highs for winter gas-fired electricity generation. From January 13-16, NG power outpaced the use of coal, nuclear, wind, and solar combined. Although a small sample set, this data shows a growing dependence on natural gas as a power source.
Currently, countries in the Northern Hemisphere are driving toward the summer months. New forecasts from the National Oceanic and Atmospheric Administration (NOAA) say that there is a 55% chance that 2024 will be the warmest year on record, and a 99% chance that 2024 will land in the top five warmest years ever. While such forecasts can be fickle, extended summertime heat is on the way and will drive NG demand for cooling purposes.
Weekly EIA Natural Gas Inventories
It’s Thursday, and the US Energy Information Administration (EIA) ‘s weekly natural gas underground inventories report is due. Analysts are expecting stocks-on-hand to come in at 76 billion cubic feet, down from last week’s 79 billion cubic feet. If accurate, this could be a bullish NG market driver.
Is The Top In For Natural Gas?
Trading against trends is a no-no for commodity traders. However, there is a big difference between counter-trend scalping and taking a longer-term position against price action.

For the NATGAS CFD, there is a macro resistance zone in view. As you can see on the chart, the Monthly 50% Fibonacci Retracement at 2.511 is quickly coming into play. Also, we have a 13-month EMA sitting at 2.582 and a big round number present at 2.500.
The zone between 2.500 and 2.582 has a great shot at setting up as significant topside resistance. Is this the top of the market? We’ll soon find out. At press time, NATGAS is up more than 3% on the session. If the bidding continues, the 2.500 area is in for a test ahead of Friday’s closing bell.
Risk Disclosure: The information provided in this article is not intended to give financial advice, recommend investments, guarantee profits, or shield you from losses. Our content is only for informational purposes and to help you understand the risks and complexity of these markets by providing objective analysis. Before trading, carefully consider your experience, financial goals, and risk tolerance. Trading involves significant potential for financial loss and isn't suitable for everyone.


