


The forecast for cooler temperatures suggests continued lower demand for natural gas, while U.S. dry gas production remains robust at 99.5 bcf/day.
Key Points
- June Nymex natural gas prices closed at $2.52, down by 5.16%, due to forecasts of cooler temperatures reducing demand.
- Today’s prices opened at $2.503 and are slightly lower at $2.500, with issues at the Freeport LNG terminal continuing to impact supply.
- Market participants are watching the upcoming EIA storage report and Freeport LNG terminal updates for potential price changes.
Natural Gas Daily Price Analysis – 27/05/2024
On Friday, June Nymex natural gas prices closed sharply lower at $2.52, down by 5.16%. This decline marked a one-week low, primarily driven by forecasts predicting cooler temperatures across the Northeast and Midwest U.S. between May 29 and June 2. These cooler conditions are expected to reduce the demand for natural gas used in electricity generation for air conditioning.
Earlier in the past week, natural gas prices rallied, reaching a 4.25-month high after the weekly EIA report showed a smaller-than-expected increase in inventories. Despite this temporary rise, the overall sentiment remained bearish due to ample supplies and decreased demand during the mild winter and early spring months.
As of today, natural gas prices opened at $2.503 and are currently trading slightly lower at $2.500, reflecting a modest 0.56% decrease. The ongoing issues at the Freeport LNG export terminal in Texas continue to exert pressure on prices. Although one of the three production units has reopened partially, the complete reopening of the facility has been delayed, limiting export capacities and contributing to higher domestic inventories.
The forecast for cooler temperatures in the coming days suggests continued lower demand for natural gas in electricity generation, which could further suppress prices. Additionally, U.S. dry gas production remains robust at 99.5 bcf/day, with demand showing a year-over-year increase of 4.3%.
Key Economic Data and News to Be Released Today
Although there are no major high-impact economic data slated for today, market participants will be closely monitoring the upcoming EIA natural gas storage report. If inventory builds are smaller than expected, it could provide some upward momentum to prices. Additionally, any updates on the operational status of the Freeport LNG terminal could significantly influence market prices.
Global factors, such as strong LNG demand in Asia due to a heatwave and increased imports by China, also play a crucial role. These external demand drivers may provide some support to U.S. natural gas prices, offsetting domestic supply concerns.
Natural Gas Technical Analysis – 27/05/2024
On the technical side, NG is heavily bearish, as both the 200 EMA and the RSI suggest the price may continue to break the structure to the downside.
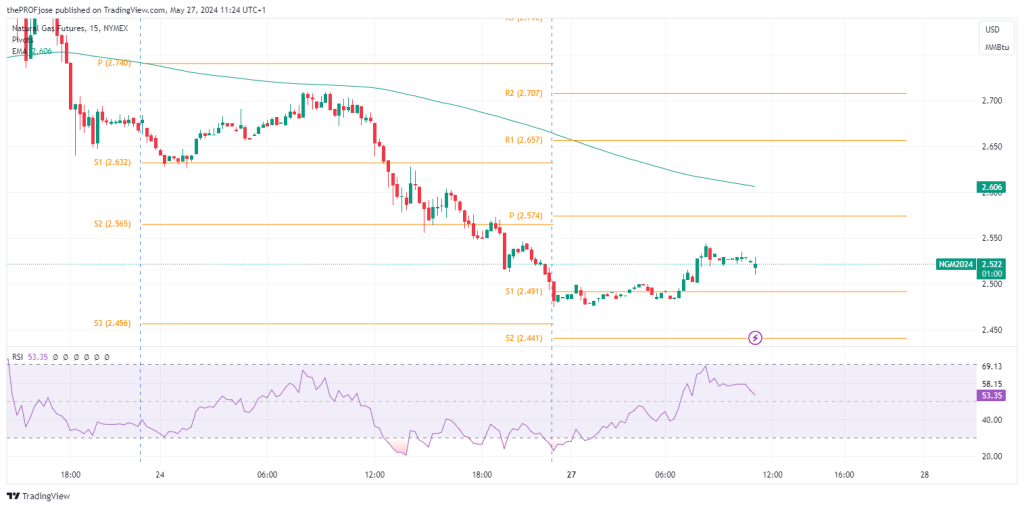
A closer look at the chart above shows Natural Gas prices to be smoothly trending downward under the sloping moving average after the RSI hit the overbought level and reversed.
In this scenario, trading against the trend may be more risky. However, for trend traders looking to short the NG, a close below the established low of the day may be the optimal trade entry.
Natural Gas Fibonacci Key Price Levels 27/05/2024
Short-term traders planning to invest in NG today should keep a close eye on the following key price levels for the day:
| Support | Resistance |
| 2.491 | 2.657 |
| 2.441 | 2.707 |
| 2.358 | 2.790 |
Risk Disclosure: The information provided in this article is not intended to give financial advice, recommend investments, guarantee profits, or shield you from losses. Our content is only for informational purposes and to help you understand the risks and complexity of these markets by providing objective analysis. Before trading, carefully consider your experience, financial goals, and risk tolerance. Trading involves significant potential for financial loss and isn't suitable for everyone.


