


Initial spikes in gold prices to $2,417.00 were triggered by the escalation in Israel-Iran tensions, but subsequent pullbacks to $2,382.31 indicate a market reassessment.
Key Points
- Gold concluded Thursday’s session with a 0.74% increase, closing at $2,378.25, as it continued to attract safe-haven demand amidst geopolitical uncertainties and mixed economic signals.
- The Fed’s steady interest rate policy, in light of economic inconsistencies, has bolstered gold’s attractiveness relative to interest-bearing assets.
- With no significant economic reports due today, gold traders are closely monitoring developments in the Middle East, which could heavily influence market dynamics.
Gold Daily Price Analysis – 19/04/2024
Gold ended Thursday’s trading session in positive territory, recording a close at $2,378.25, which represents a 0.74% increase from the opening at $2,360.74. The precious metal continued to find support as a safe haven amidst a backdrop of uncertain economic data and global geopolitical concerns.
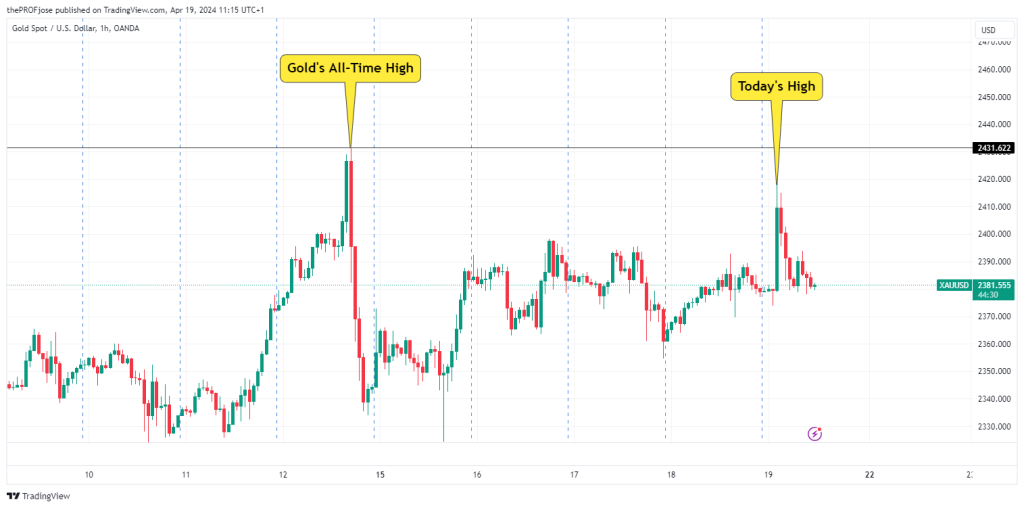
Today’s trading saw gold commence slightly higher at $2,379.98. The early hours witnessed a sharp rise to $2,417.00, closely approaching the record high, driven by news of an Israeli strike on Iran, which escalated regional tensions significantly. Despite this, gold retraced to $2,382.31, up modestly by 0.08% from yesterday’s close, suggesting a corrective pullback after the initial knee-jerk reaction to geopolitical news.
The intensifying conflict between Israel and Iran significantly influenced gold markets today, as the initial surge in prices demonstrated gold’s status as a refuge in times of crisis. However, the inability to sustain early gains at the peak levels points towards a market that is cautiously evaluating the longer-term implications of the Middle East tensions on global stability.
Further complicating the market’s trajectory is the Federal Reserve’s current monetary policy stance. The decision to hold interest rates steady despite ongoing challenges with inflation and a resilient U.S. economy plays a pivotal role in the financial markets. For gold, which does not yield interest, the Fed’s pause on rate hikes helps maintain its attractiveness compared to yield-bearing assets, particularly during times of market stress.
Key Economic Data and News to Be Released Today
Today, there are no high-impact economic data releases scheduled, allowing traders to focus more on geopolitical developments. Investors should keep a close watch on the situation between Israel and Iran, as any escalation or resolution could trigger significant movements in gold prices. The absence of major economic announcements today means that geopolitical news could have an amplified effect on market sentiment and trading behavior.
Gold Technical Analysis – 19/04/2024
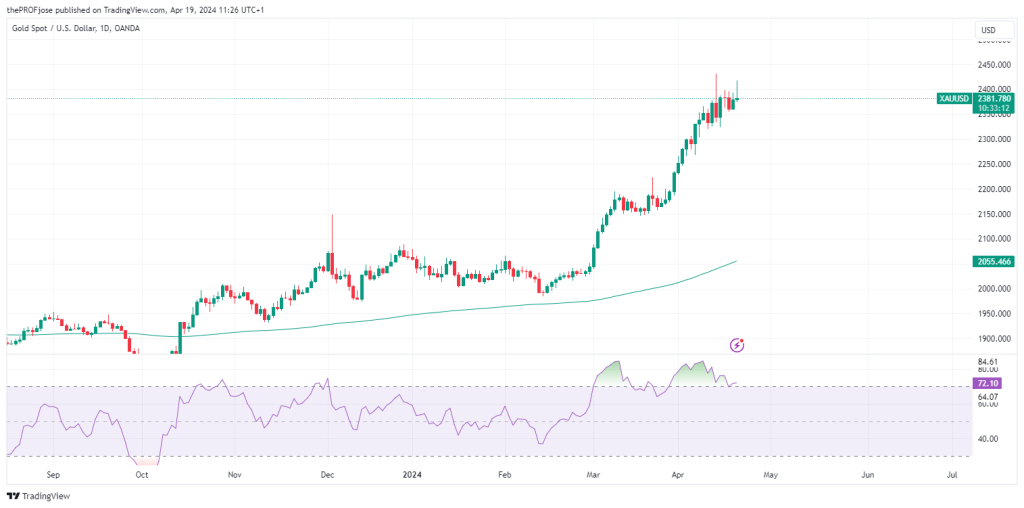
Gold has been displaying a bullish momentum on the daily chart, consistently trading above the 200 Exponential Moving Average, which signifies a strong long-term upward trend.
Despite this positive trajectory, caution is warranted as the RSI has ventured into the overbought level. This development suggests that gold may be due for a pullback or potentially a bearish reversal, as the market might be overstretched.
Looking at the shorter M15 timeframe, gold’s price action is currently in a phase of consolidation. The trading pattern shows the price oscillating around the 200 EMA, indicating a lack of clear direction in the near term.
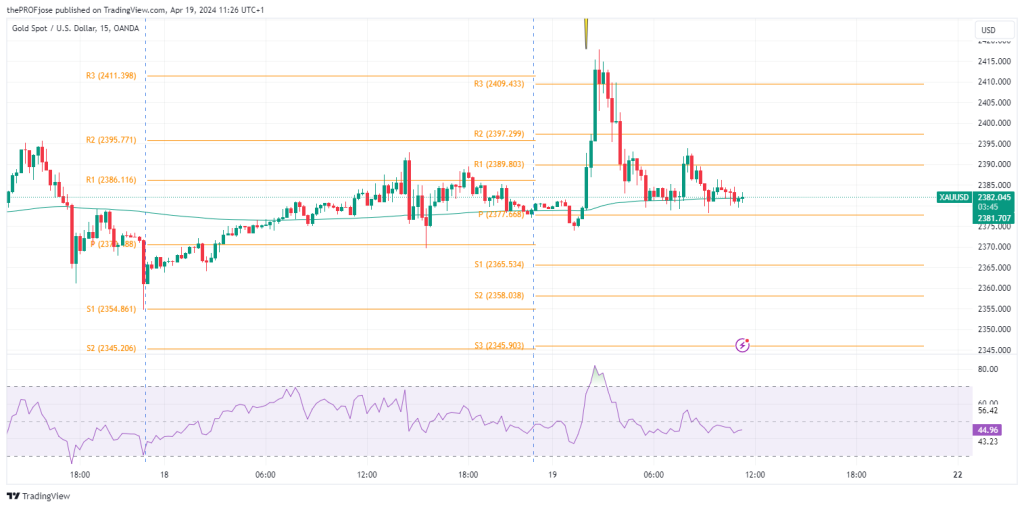
A sustained break above the R3 resistance level could indicate a continuation of the bullish trend, signaling an opportunity for buyers to enter the market.
Conversely, a close below the S1 support level might confirm a short-term bearish outlook, which could be an indication for traders to consider short positions.
Gold Fibonacci Key Price Levels 19/04/2024
Short-term traders planning to trade gold today should keep a close eye on the following key price levels for the day:
| Support | Resistance |
| 2365.534 | 2389.803 |
| 2358.038 | 2397.299 |
| 2345.903 | 2409.433 |
Risk Disclosure: The information provided in this article is not intended to give financial advice, recommend investments, guarantee profits, or shield you from losses. Our content is only for informational purposes and to help you understand the risks and complexity of these markets by providing objective analysis. Before trading, carefully consider your experience, financial goals, and risk tolerance. Trading involves significant potential for financial loss and isn't suitable for everyone.


