


As investors brace for crucial FOMC updates and unemployment data, technical analysis reveals a bearish trend outlook on Gold.
Key Points
- After a brief dip, Gold recovered to close slightly higher yesterday. However, today’s early trading shows a decline.
- Investors are watching for FOMC updates and unemployment data, which could sway Gold prices depending on the economic outlook and dollar strength.
- Gold’s trend outlook is bearish in the short term, as indicated by its fall below key levels.
Gold Daily Price Analysis – 19/03/2024
Yesterday, Gold took a quick dip to reach a low of $2,149.20. The rest of the day saw the precious metal regaining strength and reaching a high of $2,167.20. After this significant move to the upside, the asset only made a marginal net gain of +0.13%, closing the trading day at $2,164.30 after opening at $2,159.90.
This slight uptick in Gold prices can be attributed to investors seeking safe-haven assets amidst uncertainties in the market. Although the change was minimal, it indicated a cautious optimism among investors, possibly due to mixed economic signals or geopolitical tensions that often enhance the appeal of Gold as a risk-averse investment.
In contrast, Gold has witnessed a decline in the early trading hours of today, with a current price of $2,157.80, down by -0.31% from yesterday’s close. The metal opened the day at $2,165.60 but failed to sustain the momentum, reaching a high of $2,166.30 before falling to a low of $2,150.30. This pullback could be a reaction to a strengthening US dollar and rising bond yields, which typically inversely affect Gold prices. Investors may also adjust their positions in anticipation of upcoming economic data releases or policy announcements.
Key Economic Data and News to Be Released Today
Investors are keenly awaiting the release of high-impact economic data and news, with particular attention on the Federal Open Market Committee (FOMC) updates and unemployment data expected later in the week.
The FOMC’s stance on interest rates and monetary policy is pivotal for financial markets, with any hints of tightening or dovish changes potentially influencing the US dollar’s strength and, inversely, Gold prices. Similarly, unemployment data serve as a crucial indicator of economic health.
Strong employment figures signal economic resilience, leading to higher yields and a stronger dollar, thereby pressuring Gold prices. Conversely, weaker-than-expected job numbers could heighten economic uncertainty, bolstering Gold’s safe-haven appeal.
Gold Technical Analysis – 19/03/2024
Today’s technical analysis of gold suggests a bearish trend sentiment. Gold’s price fell below the 200-day Exponential Moving Average earlier, indicating a shift from an upward to a downward trend. The price dropped below the daily pivot point, pushing it further down.
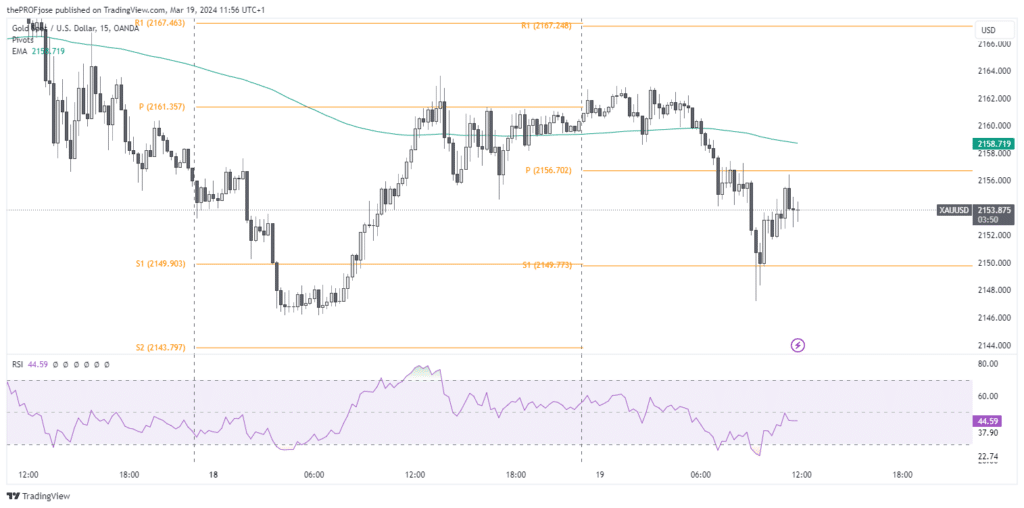
As seen in the chart, when Gold’s price reached the S1 support level, and at the same time, the RSI showed that Gold was being oversold, it could have looked like the tide was turning back in favor of those looking to buy Gold. However, unless Gold’s price rises and closes above the 200 EMA, the outlook for Gold remains strongly bearish.
Gold Fibonacci Key Price Levels 19/03/2024
Short-term traders planning to trade gold today should keep a close eye on the following key price levels for the day:
| Support | Resistance |
| 2153.72 | 2158.83 |
| 2155.13 | 2159.71 |
| 2156.01 | 2161.12 |
Risk Disclosure: The information provided in this article is not intended to give financial advice, recommend investments, guarantee profits, or shield you from losses. Our content is only for informational purposes and to help you understand the risks and complexity of these markets by providing objective analysis. Before trading, carefully consider your experience, financial goals, and risk tolerance. Trading involves significant potential for financial loss and isn't suitable for everyone.


