The Federal Reserve’s potential interest rate cuts, expected by nearly 50% by September, have significantly influenced investor interest in gold.
Key Points
- Gold rose by 1.63% due to unexpected U.S. job market data, indicating potential Federal Reserve rate cuts.
- Today, geopolitical tensions and U.S. trade policies pushed gold up by 1.24% to $2375.260.
- Upcoming Michigan Consumer Sentiment Index and Federal Reserve speeches could influence gold’s price.
Gold Daily Price Analysis – 10/05/2024
Gold witnessed a notable ascent in yesterday’s trading session, with the closing price reaching $2346.245 after opening at $2308.690, marking a significant increase of 1.63%. This upward movement was influenced mainly by unexpected developments in the U.S. job market. Thursday’s data revealed a surge in weekly U.S. jobless claims to 231,000, significantly above the anticipated 210,000. This increase, coupled with April’s disappointing addition of only 175,000 nonfarm payroll jobs, significantly below expectations, has led to heightened speculation that the Federal Reserve might implement interest rate cuts sooner than anticipated to support economic growth.
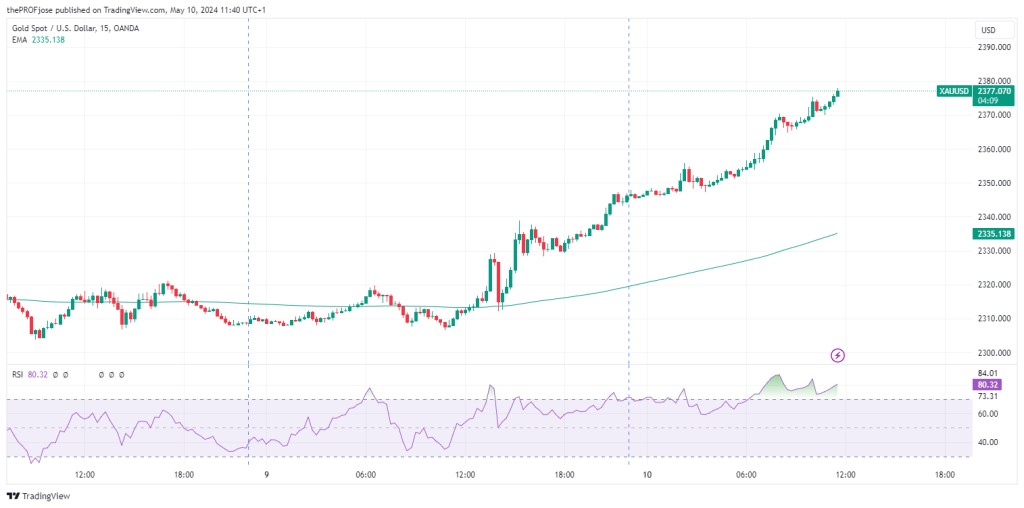
Today, Gold opened at $2346.245 and has climbed to a current price of $2375.260, reflecting an increase of 1.24%. The absence of a ceasefire between Israel and Hamas, alongside the introduction of new U.S. trade tariffs on China, has further propelled demand for gold as a safe-haven asset. The geopolitical uncertainties, including the potential U.S. response to Israeli actions in Gaza, continue to underpin gold’s appeal. By mid-morning GMT, spot gold had peaked at $2,372.16 per ounce, marking its highest level in over two weeks and signaling the metal’s best performance since early April.
The recent U.S. economic figures have played a pivotal role in shaping gold’s trajectory. With the Federal Reserve’s potential rate cuts on the horizon, as suggested by nearly a 50% likelihood of a reduction by September per the CME FedWatch Tool, investors are increasingly drawn to the metal. The anticipation of lower interest rates, which diminish the opportunity cost of holding non-yielding assets like gold, has been a critical factor in its price increase.
Key Economic Data and News to Be Released Today
Today’s economic calendar includes the release of the Michigan Consumer Sentiment Index, and speeches from Federal Reserve officials, including Governors Michelle Bowman, Logan, and Neel Kashkari, are scheduled. These presentations will provide further insights into the Fed’s views on the current economic landscape and potential future monetary policies.
Investors are also keenly awaiting the release of the U.S. producer and consumer price index data due next week, which could provide further insights into the Federal Reserve’s rate decisions. These indicators are expected to shed light on the ongoing inflationary trends and could significantly influence gold’s short-term pricing.
Gold Technical Analysis – 10/05/2024
Gold is currently trading above its 200 EMA, indicating a sustained bullish trend. However, the RSI has entered the overbought territory, signaling potential overvaluation and the possibility of a near-term retracement or consolidation phase. This divergence suggests that while the long-term momentum is positive, the market may face short-term volatility.

Traders should approach cautiously and look for additional signals before committing to positions. The conflicting signals from the 200 EMA and RSI necessitate a more prudent strategy, waiting for the RSI to retreat from the overbought zone or for other technical and fundamental indicators to align before making significant moves.
Risk Disclosure: The information provided in this article is not intended to give financial advice, recommend investments, guarantee profits, or shield you from losses. Our content is only for informational purposes and to help you understand the risks and complexity of these markets by providing objective analysis. Before trading, carefully consider your experience, financial goals, and risk tolerance. Trading involves significant potential for financial loss and isn't suitable for everyone.


