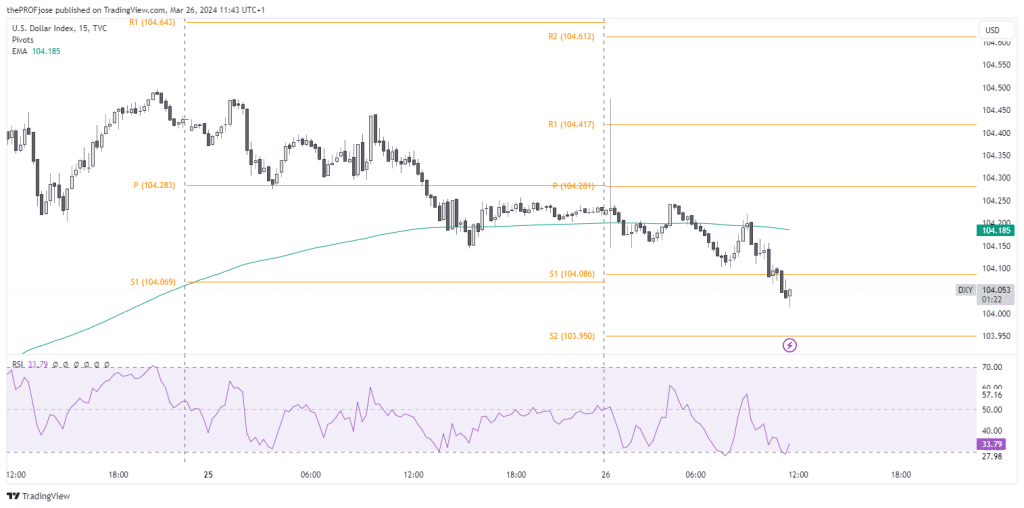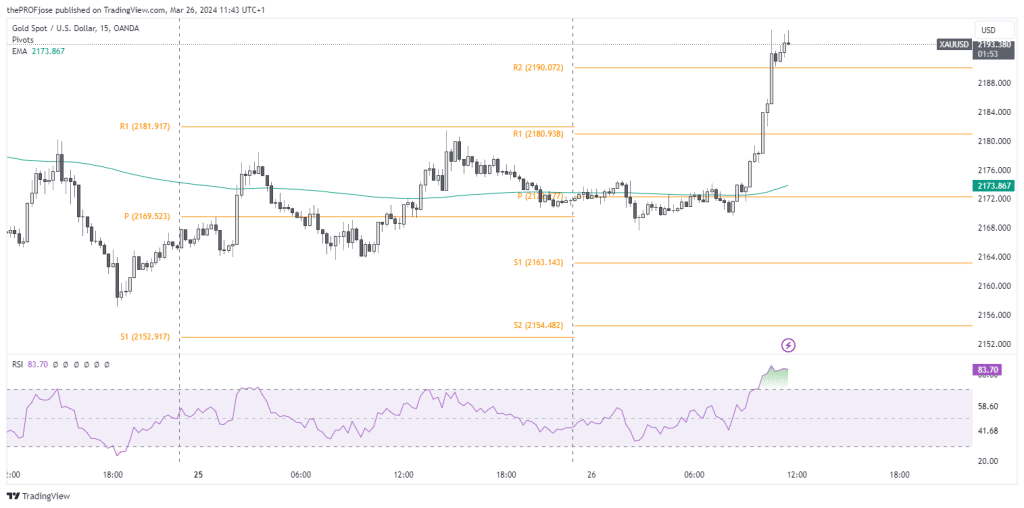
Gold prices surged this morning, reaching close to $2200, attributed largely to the weakening of the dollar against major currencies, influenced by expectations of Federal Reserve interest rate cuts.
Key Points
- The dollar index’s decline, moving away from five-week highs, is a reaction to anticipations of Fed interest rate cuts.
- Comments from Fed Chicago President Austan Goolsbey suggested the possibility of up to three interest rate cuts this year.
- Technical analysis indicates that gold has regained bullish momentum, breaking above the 200 EMA and several resistance levels, though the RSI hints at potential overbought conditions.
Gold Daily Price Analysis – 26/03/2024
Yesterday, gold prices experienced a positive shift, closing at $2,176.40, up by 0.76% from its opening price of $2,166.60. The day witnessed the precious metal hitting a high of $2,182.50 and a low of $2,164.40, underlining a bullish sentiment among investors. The uptrend appeared to be fueled by a mix of speculative trading and investor optimism toward safe-haven assets amid a volatile market landscape.
As of today, gold prices have surged even further, currently trading at $2,197.25, marking a 0.97% increase from the opening price of $2,173.35. The asset has touched a daily high of $2,200.50 and a low of $2,168.30, showcasing a robust demand for gold as it hits the $2200 mark. This uptrend in gold prices is largely attributed to the weakening of the dollar against a basket of major currencies.

The dollar’s depreciation in recent days is a reaction to increasing bets that the Federal Reserve will initiate interest rate cuts starting from the June meeting. The dollar index, which tracks the greenback against a group of major rivals, fell by 0.15% today, moving away from five-week highs at 104.50. This shift comes on the heels of bearish remarks by Federal Reserve officials, hinting at a potential 0.25% rate cut in June, subsequently decreasing the dollar’s appeal, thus elevating gold’s status as a preferred investment.
Fed Chicago President Austan Goolsbey’s comments on Monday further bolstered market expectations for up to three interest rate cuts this year. Nevertheless, a note of caution was sounded, indicating that the Federal Reserve would adopt a data-driven approach before implementing any rate adjustments.
Key Economic Data and News to Be Released Today
Today’s economic calendar is notably thin on high-impact data that could directly influence gold prices. However, investors remain vigilant, parsing through any minor reports such as (durable goods orders consumer confidence data) and global economic news that could sway market sentiment.
The focus is predominantly on any further commentary from Federal Reserve officials or unexpected geopolitical developments that could provide additional support to gold prices.
Gold Technical Analysis – 26/03/2024
Yesterday price struggled to give a clear view of the market’s trend, as price struggled to stay above or below the intraday 200 moving average. However, today’s price action is different. Gold price seems to have regained its bullish momentum, breaking above the 200 EMA and several resistance levels.

Although the EMA and Pivot Indicators present a positive market trend, the RSI, on the other hand, suggests that short-term buyers should exercise caution as the precious metal might be overbought.
Gold Fibonacci Key Price Levels 26/03/2024
Short-term traders planning to trade gold today should keep a close eye on the following key price levels for the day:
| Support | Resistance |
| 2187.45 | 2200.23 |
| 2190.98 | 2202.42 |
| 2193.17 | 2205.95 |
Risk Disclosure: The information provided in this article is not intended to give financial advice, recommend investments, guarantee profits, or shield you from losses. Our content is only for informational purposes and to help you understand the risks and complexity of these markets by providing objective analysis. Before trading, carefully consider your experience, financial goals, and risk tolerance. Trading involves significant potential for financial loss and isn't suitable for everyone.


