


Gold prices fell sharply yesterday as the Fed is projected to take a hawkish stance on rate cuts following higher-than-expected inflation data.
Key Points
- Gold prices dropped yesterday after the release of strong CPI data.
- Fundamentally, the Fed’s hawkish stance on rate cuts can set the tone.
- If the price doesn’t stabilize in the near term, we may see gold plummet further to $1973 or $1965.
Gold Daily Price Analysis – 14/02/2024
Hotter-than-expected CPI that shows an increase in core inflation in the US sent the probability of a rate cut lower in the next Fed meeting. As a result, gold prices dropped following the resort, with gold spot prices shedding 1.33%. Today, the fall has continued, as the price has further lost -0.2% as we speak to fall to $1991.
Yesterday’s CPI data was higher than analysts anticipated, suggesting that any efforts at disinflation and rate cuts would take a backseat for now. This means treasury bonds will continue to have higher yields, the US currency will retain its strength, and less attention will be paid to safe-haven assets, like the yellow metal.
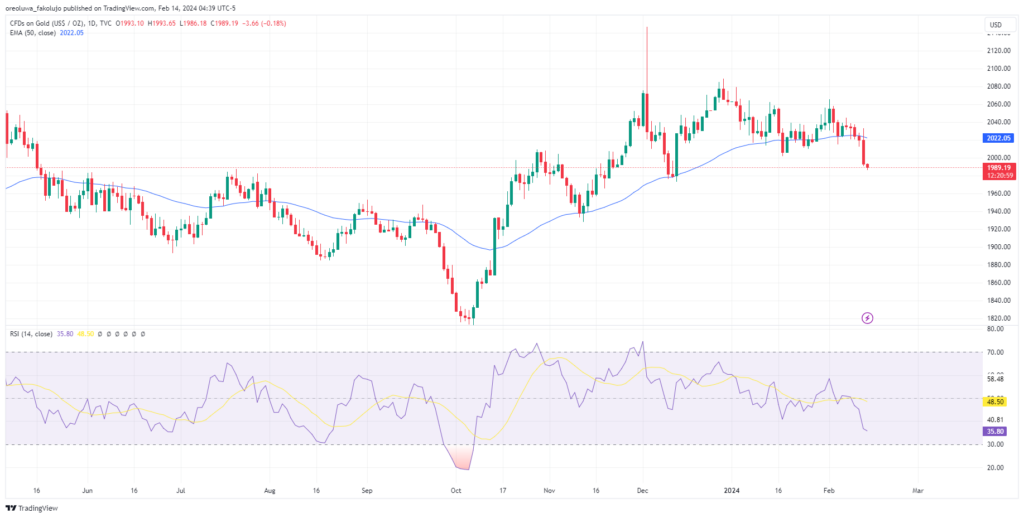
Technically, on the daily chart, the price of Gold fell far below the 50 EMA, and the RSI fell below the 50 line, indicating a heavily bearish atmosphere for the precious metal.
Gold Technical Analysis – 14/02/2024
Yesterday, the price of gold fell heavily, but we’re still awaiting the aftermath of this fall from a technical perspective. Do we see an immediate retracement? Or do we get a further drop today?
Only time will answer those questions. But whatever happens, these are some key levels to pay attention to:
On the upside, traders should carefully watch the $1999.09, $2006.27, and $2011.38 price levels, which coincide with the 0.786, 0.618, and 0.5 levels of the Fibonacci retracement tool, respectively. A rise above these levels will be a huge statement of intent on the part of the bulls.
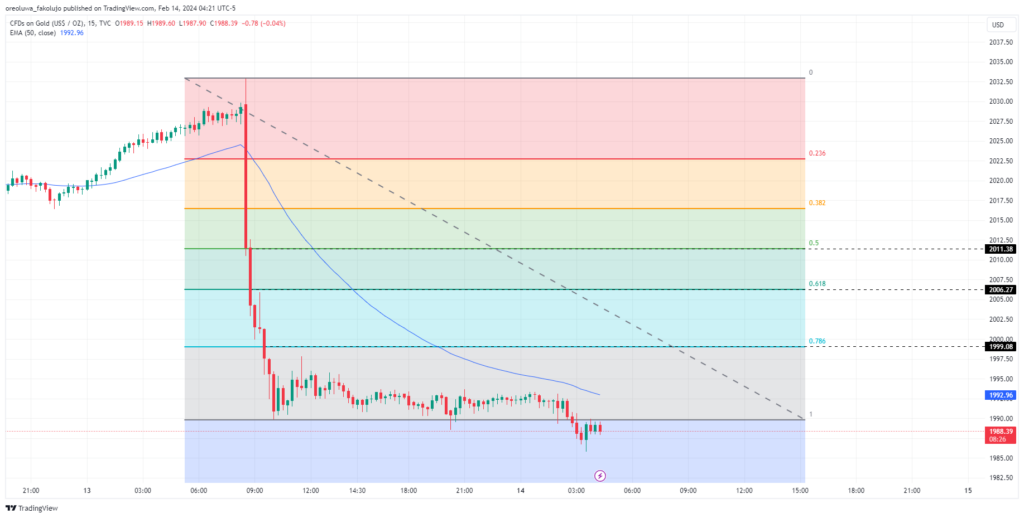
On the bottom side of the price, gold may be testing several key levels. At first, the 1979.02 is the next target, followed by $1973.13. If the price breaks these two levels, the next target can be $1965.57, which is waiting to be tested.
Gold Fibonacci Key Price Levels 14/02/2024
Based on the daily chart, here are the key XAU/USD Fibonacci support and resistance levels to watch as of 14/02/2024.
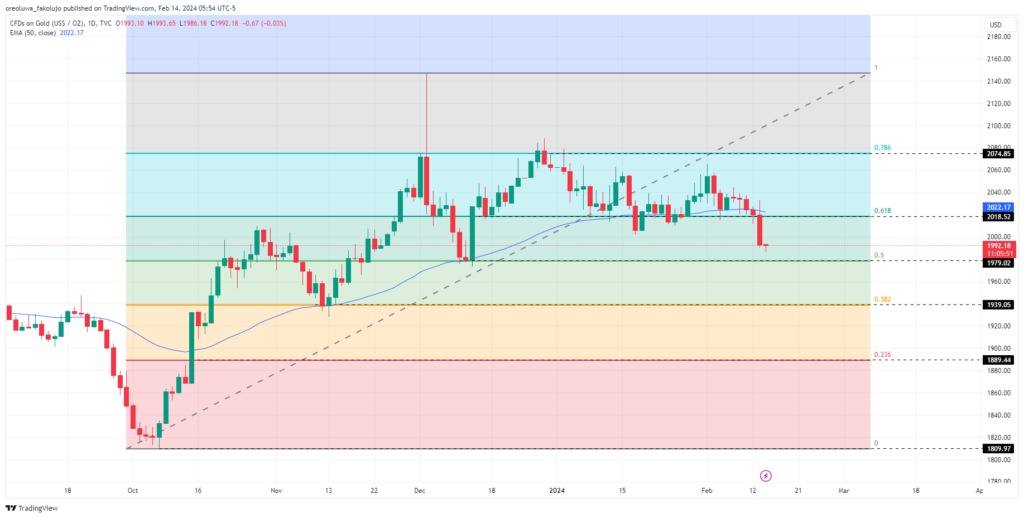
| Support | Resistance |
| $1979.02 | $1999.09 |
| $1939.05 | $2006.27 |
| $1889.44 | $2011.38 |
| $1809.97 | $2018.52 |
| $2074.85 |
Risk Disclosure: The information provided in this article is not intended to give financial advice, recommend investments, guarantee profits, or shield you from losses. Our content is only for informational purposes and to help you understand the risks and complexity of these markets by providing objective analysis. Before trading, carefully consider your experience, financial goals, and risk tolerance. Trading involves significant potential for financial loss and isn't suitable for everyone.


