


As geopolitical tensions and economic uncertainties continue to hover over the financial markets, gold has again entered the spotlight as a potential safe haven for investors.
Key Points
- Gold witnessed a bullish trend yesterday, affirming a solid footing above the $2,000 psychological level.
- The momentum continues today as gold prices are clutching onto the $2,027 level, up 0.45%.
- Key economic data releases and FOMC minutes loom over the horizon, potentially catalyzing the next significant move in the gold market.
Gold Daily Price Analysis – 20/02/2024
Yesterday’s trade saw gold edging higher, closing at $2,017.63 after testing the resistance at $2,020 and a slight +0.22% growth. Today’s trading session started on a similar note, with gold prices opening above the pivot point, making a solid +0.45% increment over the opening price, indicating a continuation of the bullish sentiment from the previous day.
So far, traders are weighing their options, awaiting fresh news or economic data that could influence gold’s value. As inflation numbers turned out higher than expected last week, gold could see an uptick as it’s often favored during such times. Currently, gold is hovering around key levels, suggesting it may either climb or dip based on upcoming economic updates.
Key Economic Data and News to Be Released Today
The gold market is now casting its eyes on the upcoming economic calendar, with high-impact events that could significantly influence the market’s direction. Notably, the Canadian inflation data and the Federal Open Market Committee (FOMC) minutes are on the radar. A higher-than-expected inflation rate could rekindle gold’s appeal as an inflation hedge, potentially leading to an upward price movement.
Market analysts are divided, with some expecting gold to continue its ascent in light of persistent inflation fears and others cautioning that a strong dollar could cap gold’s gains. The release of the FOMC minutes tomorrow could clarify the U.S. monetary policy further, potentially causing market volatility. Investors and traders will watch these developments keenly to gauge the market’s next move.
Gold Technical Analysis – 20/02/2024
The last four trading days have seen Gold consistently breaking above resistance levels while bouncing off support levels.
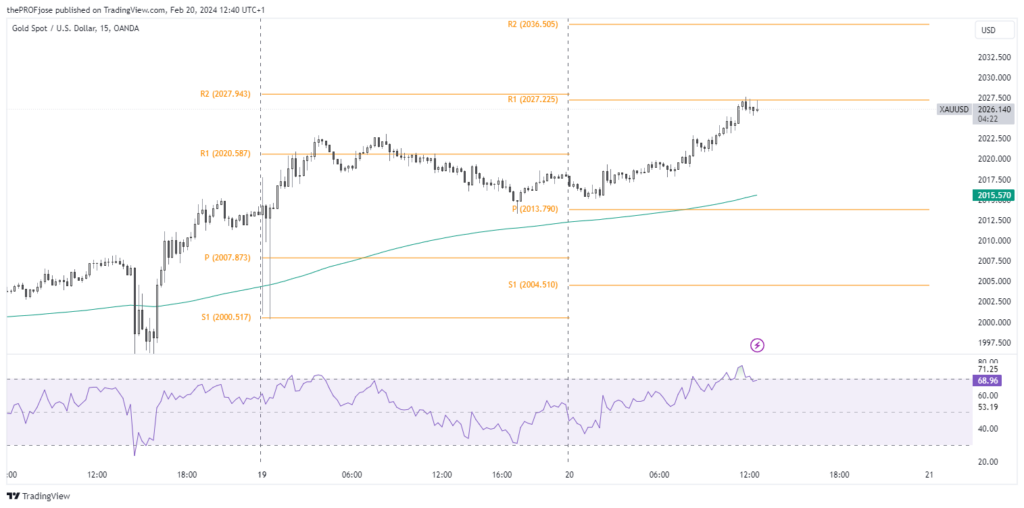
Currently, XAU/USD price is soaring above the 200 EMA but is stuck at the R1 resistance level. Also, the RSI suggests that the yellow metal is overbought, which may lead to a prolonged consolidation, a breakout, or a reversal.
Gold Fibonacci Key Price Levels 20/02/2024
Short-term traders planning to trade gold today should keep a close eye on the following key price levels for the day:
| Support | Resistance |
| 2021.72 | 2027.33 |
| 2023.27 | 2028.29 |
| 2024.23 | 2029.84 |
Risk Disclosure: The information provided in this article is not intended to give financial advice, recommend investments, guarantee profits, or shield you from losses. Our content is only for informational purposes and to help you understand the risks and complexity of these markets by providing objective analysis. Before trading, carefully consider your experience, financial goals, and risk tolerance. Trading involves significant potential for financial loss and isn't suitable for everyone.


