Market anticipation of U.S. CPI data is driving gold’s steady ascent, with a 0.39% gain today building on yesterday’s 1.21% increase.
Key Points
- Middle East tensions boost safe-haven demand for gold.
- China’s resumed gold purchases signal strong central bank interest.
- Wall Street targets $3,000 gold by 2025, citing strong fundamentals.
Gold Daily Price Analysis – 11/12/2024
Gold prices are experiencing a steady ascent as the market eagerly anticipates key U.S. economic data. Futures rose 0.3% to $2,725.60 per troy ounce, with spot prices also climbing to $2,729.1 in early trading. The current uptick builds on yesterday’s robust 1.21% gain, reflecting a combination of factors influencing investor sentiment.
Geopolitical tensions continue to provide a supportive backdrop for gold. Escalating conflict in the Middle East, notably Israel’s strikes on strategic weapon stockpiles in Syria, has heightened risk aversion among investors. Safe-haven demand remains robust, as gold is often perceived as the ultimate hedge during times of geopolitical instability.
Adding to the bullish sentiment is China’s central bank resuming gold purchases after a six-month hiatus. This move underscores the ongoing global central bank appetite for gold, further underpinning prices.
Wall Street’s optimistic outlook on gold, including Goldman Sachs’ $3,000 per ounce target by 2025, reinforces confidence in the yellow metal. Even in a scenario of temporary dollar strength, gold’s long-term fundamentals remain strong.
Key Economic Data and News to Be Released Today
The most significant driver today is the market’s anticipation of the U.S. CPI report. Forecasted at 2.7% for November, up from October’s 2.6%, the data could solidify expectations of a Federal Reserve interest rate cut during its December 17–18 meeting.
A 25-basis-point cut is already priced in with a 90% probability, according to market consensus. However, deviations from CPI estimates could unsettle these expectations and cause volatility in gold prices.
A lower-than-expected CPI would support gold by weakening the U.S. dollar and reinforcing the Fed’s dovish stance. Conversely, stronger-than-expected inflation could raise doubts about the anticipated rate cut and bolster the dollar, thereby pressuring non-interest-bearing assets like gold.
Gold Technical Analysis – 11/12/2024
Gold price action today is not as straightforward as one would want to see. However, it’s not overly complicated. Let’s break it down in a bit.
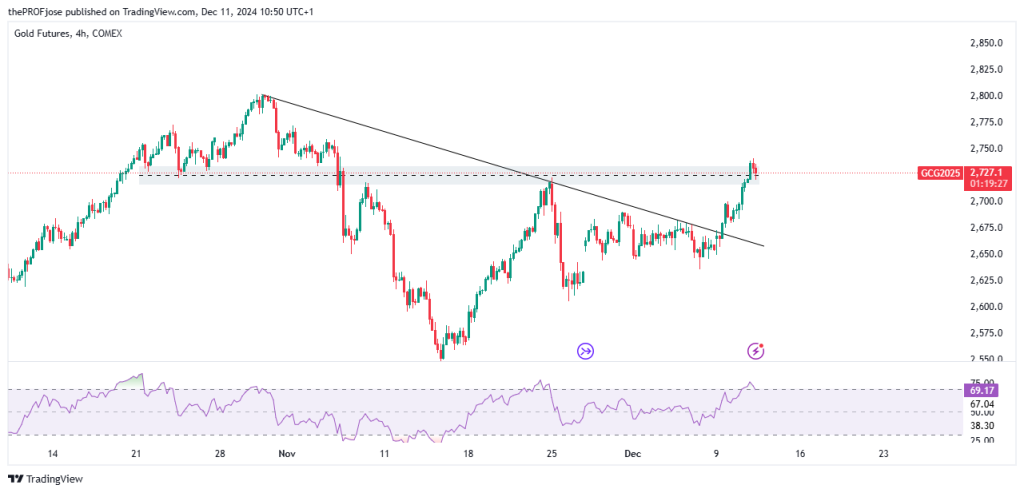
Since we use a multi-timeframe approach when it comes to analyzing price action, let’s see what’s going on in the 4-hour timeframe.
The 4-hour timeframe shows that Gold prices are inside a key level, potentially acting as a support for price. On a normal day, we can simply expect the price to react to this zone, form a bullish candlestick pattern, and zoom off to the upside. But it’s not that straightforward here because of the RSI.

If you closely monitor the Relative Strength Index (RSI) indicator, you’ll see that it shows that price is overbought, meaning that we are expecting Gold prices to retrace a little to the downside or to give a total bearish reversal. Now that we are having conflicting market sentiment on the higher timeframe, let’s scale down to the lower timeframe and see if things get clearer.
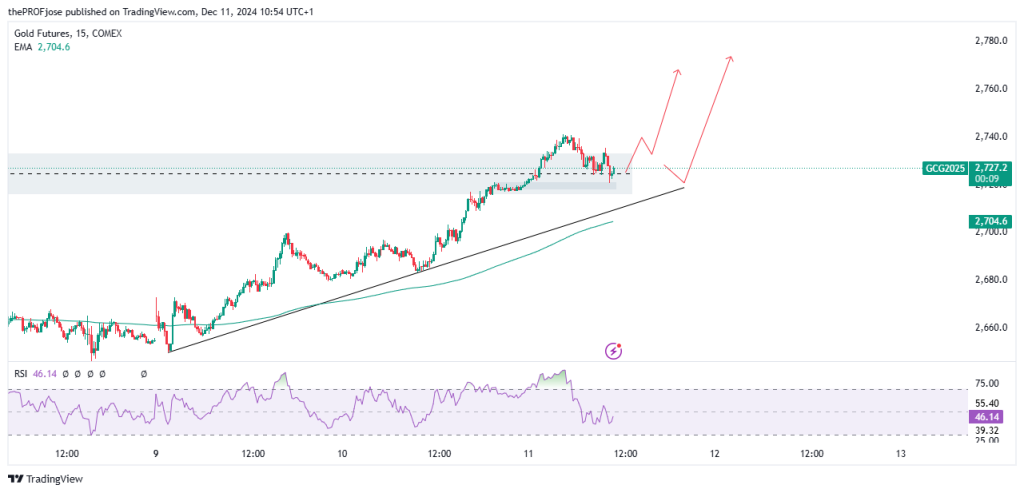
On the 15-minute timeframe, price is trending above the intraday 200 EMA, showing a continuing bullish sentiment; what this means is that as long as price is above the EMA, we can continue to look for opportunities to go long.

As you can see above, a bullish trendline setup is already forming. Should the price retrace to this trendline to give a third touch while also giving a bullish candlestick pattern confluence, we can look at a short-term long position. Otherwise, it is better to step aside and let the market give a clearer price action.
Gold Fibonacci Key Price Levels 11/12/2024
Short-term traders planning to trade gold today should keep a close eye on the following key price levels for the day:
| Support | Resistance |
| 2691.3 | 2722.6 |
| 2681.6 | 2732.3 |
| 2665.9 | 2747.9 |
Risk Disclosure: The information provided in this article is not intended to give financial advice, recommend investments, guarantee profits, or shield you from losses. Our content is only for informational purposes and to help you understand the risks and complexity of these markets by providing objective analysis. Before trading, carefully consider your experience, financial goals, and risk tolerance. Trading involves significant potential for financial loss and isn't suitable for everyone.


