Key Points
- The Federal Reserve opted for a more significant rate cut in its previous meeting in a strategy known as “front-loading.”
- Falling interest rates mean more money is in the public’s pockets, and the markets are expecting more cuts to come.
- The impact of rate cuts on the stock market can go one of two ways, depending on why the cuts are here.
- The rate cuts will likely pressure the US dollar in the short term until the rest play catch up.
- No matter the scenario, gold prices could continue to benefit from the jumbo rate cuts.
Market Overview
On September 18th, 2024, the Federal Reserve opted for a more significant rate cut of 50ps instead of taking a more cautious approach. Coincidently, the last time the Federal Reserve cut rates by more than the forecast, as per Forex Factory, was December 16th, 2008, and September 18th, 2007. On that same day in 2007, the Federal Reserve cut rates from 5.25% to 4.75%, and the stock market was sent into a buying frenzy, ending the day nearly 4% up. The reasons it did this are not dissimilar to what we see today, with inflation falling to near target and the higher risk of breaking the economy with a restrictive policy.
You may have heard the term “front-loading” being used, and that is when a central bank decides to act more aggressively at the start of a policy cycle and then hold rates there further down the line. This is to stay “ahead of the curve” regarding inflation or economic slowdowns. Jerome Powell believes that acting more aggressively now will help any unwanted adverse effects on the US economy from the restrictive rates previously. However, the truth is rates are still restrictive, so we should expect more cuts, which will impact the markets over the coming months.
What Does Falling Interest Rates Mean?
Interest rates are a reward for saving and a cost of borrowing. That means when interest rates are lower, there is less incentive to save money in banks and more incentive for borrowing. This is inflationary and helps economic growth as more money is circulated in the system. However, in a higher interest rate world, more people will be saving their hard-earned cash due to the higher return on saving, and this is deflationary and hurts economic growth prospects.
As a result, the Federal Reserve has a tricky balancing act in terms of not raising rates too high for too long, so it breaks the economy but at the same time does not create inflation by lowering rates too much. The current situation is that inflation has finally fallen to around the Federal Reserve’s target, and with rates at a high level, there is pressure on it to act so the economy does not fall off a cliff. Tricky, eh?
According to the CME Fed Watch Tool, there is a 60% chance that the Federal Reserve will opt for another 50bps rate cut at its meeting in November. December’s decision favors a 25bps cut, but 50bps is still very much on the table. It is evident that the bar is high for larger rate cuts by the end of the year.
Do Rate Cuts Mean Bullish Stocks?
The impact rate cuts can have on stocks is not as easy as saying, “Well, the Fed has cut rates, so that is good for the economy; therefore, stocks will rise.” If you look at the chart below, you will see that the biggest stock market crashes occurred after the Federal Reserve pivoted in policy. Specifically, on six occasions in the last 60 years, the Federal Reserve has lowered rates, resulting in an average S&P500 correction of 42.5%. This is because reducing rates reflects the economy entering a recession, and the Fed needs to dig it out. What is different this time?
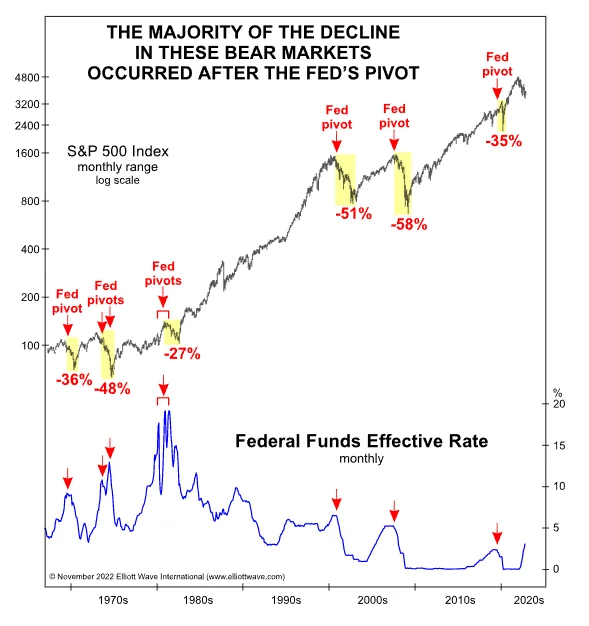
The difference this time is that the economy is resilient. Analysts such as Jeffrey Schulze, head of economic and market strategy at ClearBridge Investments, believe that “the Fed is easing and it’s a healthy economy.” The jobs data has held up exceptionally well during the hiking cycle, and the Non-Farm Payrolls report still shows an economy adding jobs. The flip side is that other data, such as the manufacturing PMIs, isn’t faring so well, and the jobs data is trending down. The clearest example is that the unemployment rate has increased by 0.5% since the first rate hike, which is a good signal that the economy is slowing down.
S&P500 Forecast
The S&P500 trades at 5725 and is in all-time high territory. This reflects the market belief that the Federal Reserve can create a soft landing scenario. This scenario is where rates are cut, and the economy remains robust. The debate on whether this can be achieved will rumble on for months.
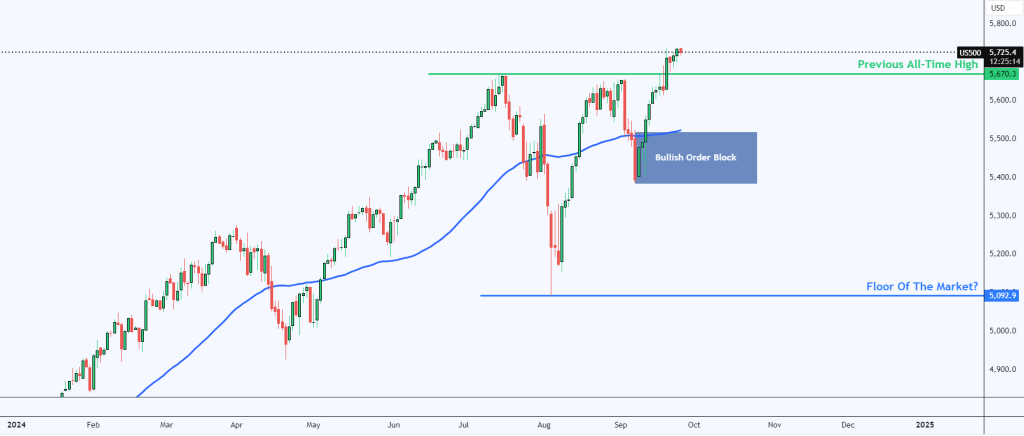
As the debate continues, the S&P500 should find plenty of support during any dips. The first and more aggressive support level is at the previous all-time high, 5670. The more cautious trader may wait for a test of the bullish order block at 5520, which has the added confluence of the 50-day moving average. A soft landing scenario could see the S&P500 reach 6000 by year-end. However, should a soft landing prove unlikely with weaker economic data released, we may see a sharp correction down to August’s low of 5096.
Check out the S&P500 market analysis for more insights about the US stock market.
Dollar Forecast
The dollar index (DXY) has been under pressure over the last few months, and that is because when a central bank decides to cut interest rates, it increases the circulation of that currency and, therefore, depreciates its value. That is precisely what has happened here, and with the Federal Reserve typically being the front-runner for others, the dollar has felt the pain.
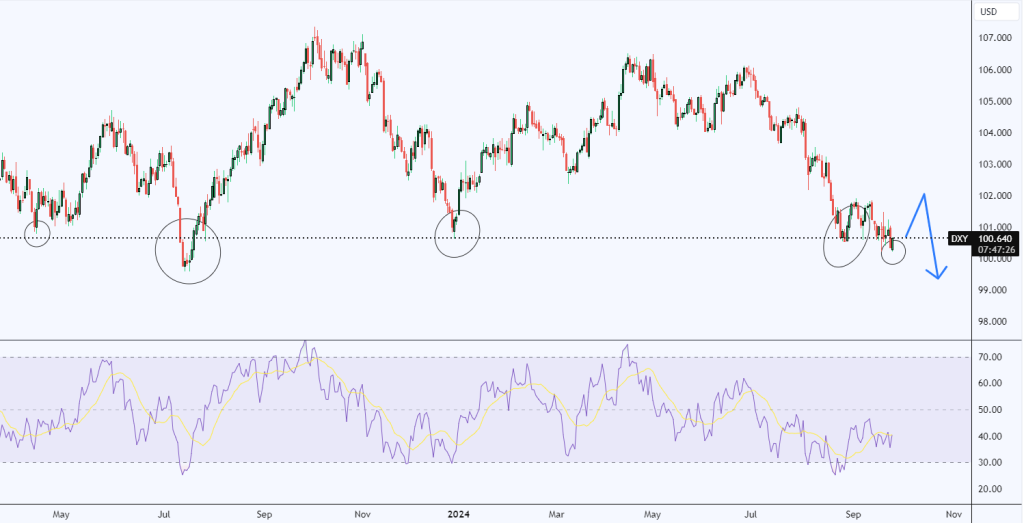
However, with so many rate cuts priced in such a short time, it will not take much to see a rebound in the US dollar (DXY). 100-101 has historically been a key support area for the dollar, and at the moment the Federal Reserve decides to remain more cautious in its approach; in that case, we could see the dollar spring to life. This is because other central banks will likely be playing catch-up at that point.
The dollar will likely remain under pressure in the short term, and the bears will be looking for a break below 100 to confirm the bear market. The bulls will look for a break above 102.000 to confirm the bullish reversal.
Gold (XAUUSD) Forecast
There has been plenty to be excited about regarding gold trading over the last few months. Gold prices traded at $2044 in early March, and just five months later, now trades up at $2660, representing the tremendous bull run it has been on. In fact, as of writing, gold trades at record levels, and it’s hard to see gold prices fall in the short term.
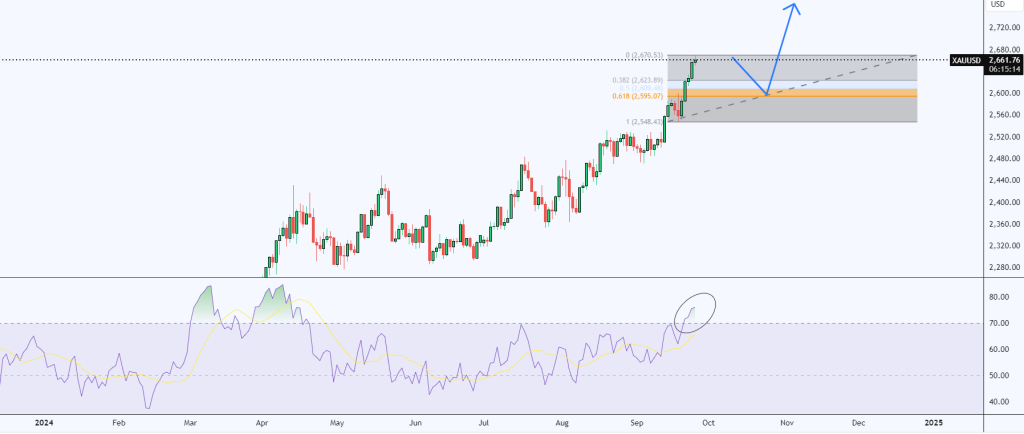
Historically, gold prices and interest rates have an inverse relationship, so gold prices rise when interest rates are lowered. However, this has already been priced into the market, and with the high barrier for interest rate cut expectations, you could expect gold to consolidate from here. It is likely that it will find support on any larger dips, so traders should be aware of this. For example, a retracement down to the 61.7% daily Fibonacci area at $2600.
Risk Disclosure: The information provided in this article is not intended to give financial advice, recommend investments, guarantee profits, or shield you from losses. Our content is only for informational purposes and to help you understand the risks and complexity of these markets by providing objective analysis. Before trading, carefully consider your experience, financial goals, and risk tolerance. Trading involves significant potential for financial loss and isn't suitable for everyone.


