Key Points
- NASDAQ breached milestone 20,000.
- Important data looms.
- NVIDIA continues to slide.
- How far can the NASDAQ fall?
Market Overview
The NASDAQ started the week on the back foot by falling 250 points during yesterday’s session. This has been the most significant daily decline since April, and traders are concerned about whether the move from 20,000 is down to profit-taking or a new trend building.
On numerous occasions, with declines more significant than this, buyers have stepped back into this market without hesitation. Often, this has resulted in new all-time highs. Should this time be any different? This week’s essential data could determine how quickly this index bounces back.
Important Data Looms
Traders will eagerly anticipate Friday’s Core PCE Price Index data, the Federal Reserve’s primary inflation gauge. Much has been said about the recent pushback on rate cuts in the latest meeting, and Friday’s data will help determine whether this is the correct approach. The forecast is for a fall in the month-on-month figure to 0.1% from 0.2%, which could give stocks a welcome boost to end the week.
Before this, traders will have Unemployment Claims and Durable Goods data to digest on Thursday. Unemployment claims have been slowly rising this year as the interest rate hiking cycle shows more evidence of biting on the economy. Look for a figure above 250k to exaggerate this. Furthermore, look out for a figure in the minuses for the Durable Goods Orders as weaker data continues to pile in.
NVIDIA Keeps Sliding
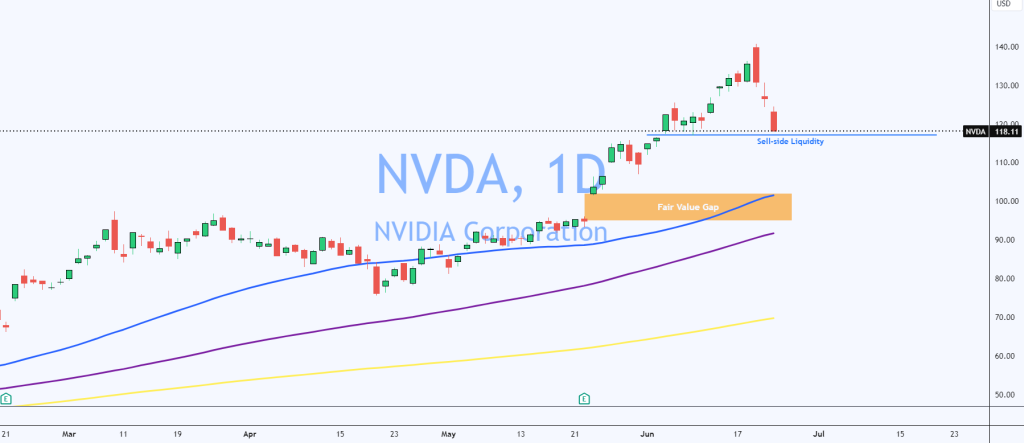
This year, much of the NASDAQ’s gains can be attributed to the remarkable gains of NVIDIA, which once made it the world’s most valuable company. However, the stock price has now dropped 16% in three trading days in a bout of significant profit-taking.

Looking at the daily chart, the over-extended nature of the NVIDIA price can be seen by how far away it trades from its key moving averages: 50,100, and 200. Despite dropping sharply in the last few days, the price is still some way from the 50-day moving average in blue. There is a Fair Value Gap at $100, and this could represent a fantastic “buy-the-dip” opportunity should it fall that far. Alternatively, the more aggressive traders will be looking to buy NVIDIA when it grabs the sell-side liquidity at $117.
How Far Can The NASDAQ Fall?
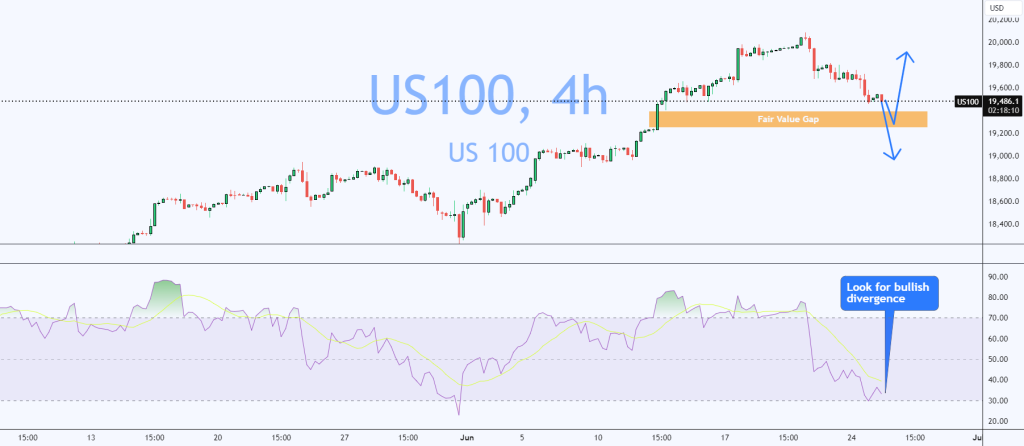
Now that we have seen a few days of downside, traders will be itching to step back into NASDAQ buy positions. The closest level of support sits at the Fair Value Gap between 19,250 and 19,400. If the price breaks below that, the market could likely test 19,000 in the coming days.

Monitoring the RSI indicator may also be beneficial because it bounces from the key 30 level. From here, look for bullish divergence as the price trades in the Fair Value Gap for extra confluence of a move higher. If the price manages to reverse, 20,000 will be the key level everyone has their eyes on.
Risk Disclosure: The information provided in this article is not intended to give financial advice, recommend investments, guarantee profits, or shield you from losses. Our content is only for informational purposes and to help you understand the risks and complexity of these markets by providing objective analysis. Before trading, carefully consider your experience, financial goals, and risk tolerance. Trading involves significant potential for financial loss and isn't suitable for everyone.


