Key Points
- Last week’s softer US data has helped the USD/JPY sellers wrestle back control over the market, and the price came close to printing a new swing low.
- US inflation is in focus this week, but the hierarchy of data importance has now shifted.
- Traders should also be prepared for Thursday’s US Jobless Claims and Producer Price Index data, as it will cause volatility in USD/JPY.
- After last week’s move, USD/JPY looks vulnerable to test August’s low, but the nature of the test will be critical.
Market Overview
Last week, US jobs data across the board failed to impress the markets. The JOLTS Job Openings data and the ADP Employment Change both disappointed markets before the main event on Friday. The US Non-Farm Payroll report added more fuel to the fire regarding recession fears, as the figure came in weak compared to the yearly average.
Although the report improved last month, the markets seem confident there will be 75-100bps worth of rate cuts from the Federal Reserve this year. How Jerome Powell navigates this tricky period of policy change is crucial as to whether the economy slips into recession or not. This blackout period before the Fed decision will have come at a welcome time for the FOMC.
US Inflation Report’s Losing Its Sparkle?
The US Consumer Price Index data was the talk of the town two years ago when the Federal Reserve began its battle against inflation. Every release since then has seen volatility in the US dollar and stock market, but this time could be different.
With inflation falling toward the Federal Reserve’s 2% target and rate cuts imminent, we are entering a new world of trading. Instead, the focus is mainly on the US jobs market and if the Federal Reserve can avoid economic collapse. This week’s inflation report predicts a yearly CPI figure of 2.6%, a 0.3% decline from the previous month. For traders to truly pay attention, the actual figure would need to come in very strong (3%+) or very weak (<2.2%). A strong figure would likely see a continuation of the USD/JPY recovery, and visa versa for a weaker figure.
Other US Data To Watch For
The only jobs data this week is the weekly jobless claims report, which is released on Thursday. This report was previously mostly ignored, but now it is of extra importance. Look for a spike in jobless claims above 250,000 to send the USD/JPY lower. Alternatively, an improvement in the jobless claims figure would be welcome news for the dollar bulls.
Furthermore, Thursday’s US Producer Price Index data is expected to increase month-on-month, which could help boost USD/JPY bull prospects. Finally, the Michigan Consumer Sentiment Index will conclude an intriguing week of price action.
USD/JPY Remains Vulnerable To Print New Low
USD/JPY has been consolidating in the mid-140s for a couple of weeks but remains under pressure without clear signs of reversal. The price currently trades at 143.500, and much resistance is coming up.
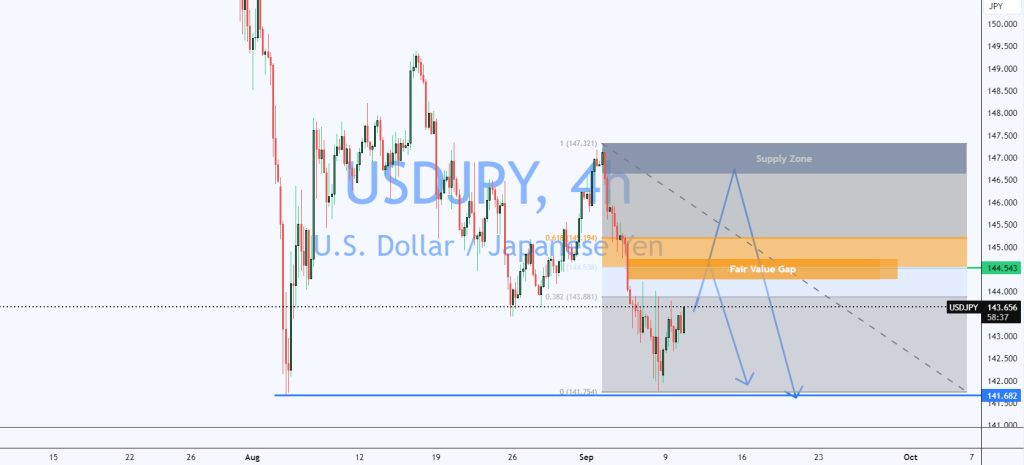
The main resistance area is 144.543, as multiple confluences stack up here. The first is the key 50% Fibonacci retracement level, which aligns perfectly with the 50% of the Fair Value Gap and 144.500 whole number resistance.
From here, the price could finally be dragged down to August’s low at 141.679, and how it reacts to this low is critical. A wick below the low with a candle closer above it would indicate a sell-side liquidity grab, which could signify a bullish reversal. A full candle closer below the low would indicate more weakness, and 140.000 could be in sight.
Risk Disclosure: The information provided in this article is not intended to give financial advice, recommend investments, guarantee profits, or shield you from losses. Our content is only for informational purposes and to help you understand the risks and complexity of these markets by providing objective analysis. Before trading, carefully consider your experience, financial goals, and risk tolerance. Trading involves significant potential for financial loss and isn't suitable for everyone.