


Key Points
- UK inflation hits 2% target.
- Why is the pound rising?
- Dollar digesting Fed divergence.
- GBPUSD to break out of range?
UK Inflation Hits 2% Target
For the first time in nearly three years, UK inflation levels hit the 2% target the Bank of England set. The headline dropped from 2.3% in April and aligned with market expectations, which is a big win for Andrew Bailey and Co. Although it is still unlikely the Bank of England will cut interest rates in tomorrow’s meeting, it has increased expectations of a cut in August.
Specifically, core inflation, which excludes energy, food, alcohol, and tobacco, dropped to 3.5% from 3.9% in April. This is entrenched inflation, which is harder to budge. Food prices have also fallen from 2.9% to 1.7%, which will relieve the UK public this morning.
Why is the Pound Rising?
After the inflation print this morning, GBPUSD gained a quick 30 pips and is currently up on the day. Traders may have been caught out by this as the typical relationship is that as inflation falls, so does the currency’s value. However, it is important to paint the bigger picture, and today’s print was in line with expectations. Therefore, the recent fall in GBPUSD may have been markets pricing this in already. Alternatively, today’s print could be seen as a sign of stability in the UK economy at a time when things seem more uncertain in the US, with inflation still a fair distance away from the 2% target. This is setting up a fascinating summer with elections on the horizon.
Dollar Digesting Fed Divergence
The dollar has been ticking higher over the past week, which can be attributed to the central bank policy divergence. The Bank of Canada and the European Central Bank both cut rates, and it now looks likely that the Bank of England will cut very soon. However, the Federal Reserve seems to be opting for a more hawkish stance and refused to celebrate after “only one month of good data.”
The door seems to be open now for a dollar bull run, which would put pressure on GBPUSD in the medium term. However, there are some hurdles on the chart to overcome first.
GBP/USD To Break Out Of Range?
On the GBPUSD daily chart, the price is trading back in the middle of the range between 1.26775 and 1.28170. Anyone trying to catch a trend in this market has been frustrated for a few weeks, but this could change.
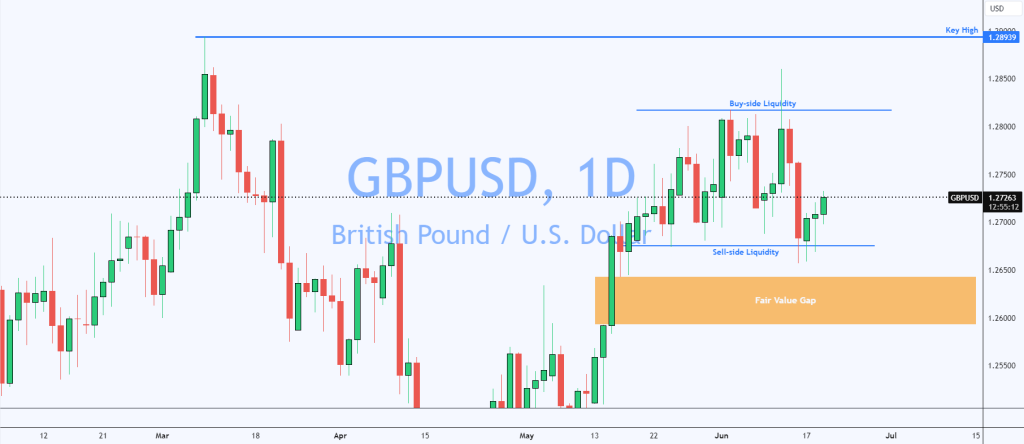
The high and low of this range represent buy-side and sell-side liquidity, respectively, and traders have witnessed a fakeout of these levels on both sides just to see the price return to roughly the middle of the range. This often means that the next move will be true, and the bears could aim to fill the Fair Value Gap at 1.26000. The conditions for this to occur would be stronger US data and a stubbornly hawkish Federal Reserve, coupled with a more dovish Bank of England.
The bulls may be looking for GBPUSD to trade all the way up to the key high at 1.28939. However, the conditions for this to occur seem less likely, with the Federal Reserve needing to change its stance on policy and the Bank of England softening expectations of a rate cut in August.
Risk Disclosure: The information provided in this article is not intended to give financial advice, recommend investments, guarantee profits, or shield you from losses. Our content is only for informational purposes and to help you understand the risks and complexity of these markets by providing objective analysis. Before trading, carefully consider your experience, financial goals, and risk tolerance. Trading involves significant potential for financial loss and isn't suitable for everyone.