GBP/USD saw steady gains over the last two days, with a minor 0.04% rise today following a 0.63% increase on Thursday, reaching 1.31312.
Key Points
- Gains are driven by expectations for UK inflation data and a likely hold on BoE interest rates.
- The US Dollar weakened amid mixed economic data and speculation of a Fed rate cut.
- Next week’s BoE and Fed decisions will be pivotal for GBP/USD’s direction.
GBP/USD Daily Price Analysis – 13/09/2024
The British Pound has been gaining steadily against the US Dollar over the past two trading days, with a minor uptick of 0.04% in today’s session, pushing the pair to a current price of 1.31312. This comes after a solid 0.63% rise on Thursday, bringing the pair back from a three-week low, as market participants look ahead to key economic data next week.
Market Sentiment and Key Economic Factors
The primary drivers behind the recent gains in GBP/USD include anticipation of the upcoming UK inflation data release on Wednesday, followed by the Bank of England’s interest rate decision on Thursday. Expectations are that the BoE will maintain its current policy, with a roughly 80% chance that interest rates will remain unchanged at 5.00%. The central bank is also expected to continue its current pace of quantitative tightening, with a focus on reducing its bond stock by £100 billion.
This stability in interest rates is seen as a balancing act, with the UK economy having shown resilience earlier this year, outperforming the Eurozone. However, July’s stagnant GDP data has created some uncertainty about the economic outlook, making Wednesday’s inflation numbers critical for shaping future monetary policy.
Dollar Weakness Adding Support
The US Dollar has also weakened slightly, with mixed economic data and growing speculation of a rate cut by the Federal Reserve next week. Investors are pricing in a 57% chance of a 25 basis-point rate cut and a 43% chance of a more aggressive 50 basis-point cut. Higher-than-expected US jobless claims and rising producer prices have muddled the economic picture, adding to the dollar’s softness.
Key Economic Data and News Outlook for the Week Ahead
Next week promises to be crucial for GBP/USD. The BoE’s decision will be influenced heavily by the UK inflation report, while traders will also keep an eye on the Federal Reserve’s rate cut decision. A dovish stance from the Fed coupled with unchanged BoE rates could extend the pair’s gains. However, any surprise moves from either central bank may quickly shift the current trend.
GBP/USD Technical Analysis – 13/09/2024
For a clearer and more reliable analysis, we will use both the 4-hour and the 15-minute timeframe to map out our bias from the higher timeframe perspective and pinpoint our entry zones on the lower timeframe.
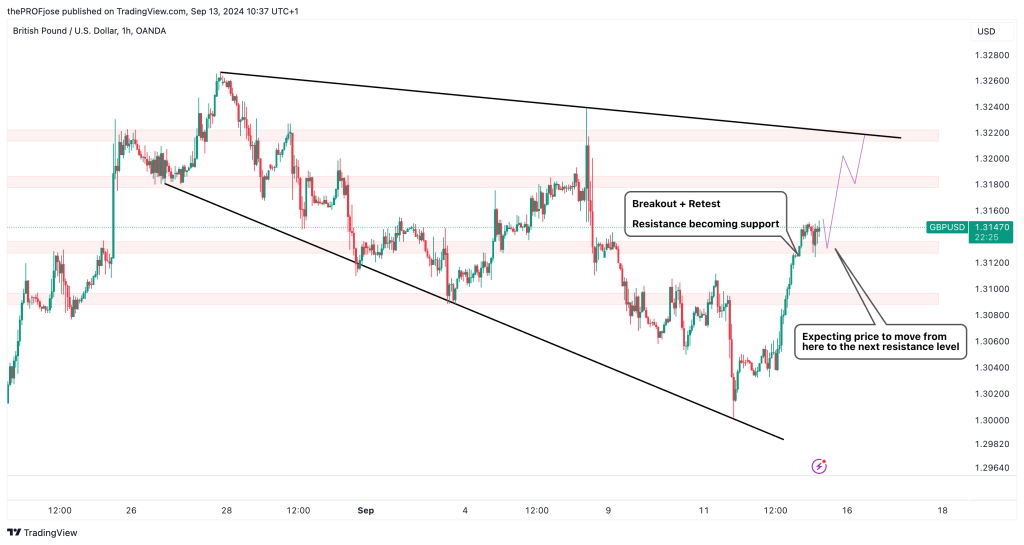
GBP/USD in the 4 hours is a bullish flag, giving us more reason to expect prices to keep soaring in coming days. A closer look at the chart shows that price just broke above a resistance zone, pulled back to the zone that has now been turned to a support before continuing its bullish run.
But before we can take a short-term trading decision, it’s important to see what is happening on a lower timeframe like the 15-minute. The 15-minute chart equally shows that the pair is heavily bullish, especially as the price is significantly moving above the 200 EMA.
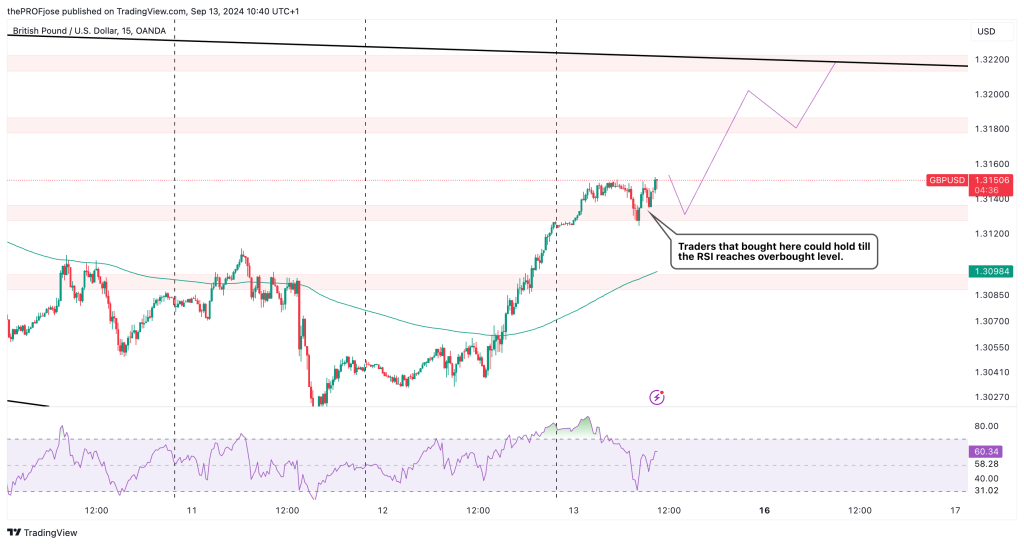
The RSI also suggests that price still has some more room for price to move to the upside before the end of today’s trading session, given that price is still in the bullish territory and it’s yet to be overbought.
Risk Disclosure: The information provided in this article is not intended to give financial advice, recommend investments, guarantee profits, or shield you from losses. Our content is only for informational purposes and to help you understand the risks and complexity of these markets by providing objective analysis. Before trading, carefully consider your experience, financial goals, and risk tolerance. Trading involves significant potential for financial loss and isn't suitable for everyone.