What Are Support and Resistance Levels in Stock Trading?
Welcome to Level 5!
It’s safe to say you are serious about becoming a knowledgeable investor. Now, are you ready to take on a new challenge? Now things will get technical. We’re about to dig deeper into the wonders of technical analysis and explore some of the most popular tools used by stock traders.
So, let’s start with a simple and highly effective technical analysis tool – support and resistance levels!
What is Support and Resistance in Stocks?
Support and resistance is one of the most widely used tools amongst stock traders that help them identify possible points on stock charts where the stock price is likely to change direction.
By studying these two levels, stock traders and investors (and other market participants) can better understand what is happening in the stock market and find many trading opportunities. It’s all about price action and those price drops, price breaks, and price highs! Further, remember that support and resistance price levels tend to be round numbers or near them.
Bear in mind that there are different techniques for using support and resistance lines. One way is to find a trading range where prices consolidate inside support and resistance levels.
Traders typically use this trading strategy when a stock is traded sideways to buy the asset at the bottom (the support price level) and sell it at the resistance level. When the price breaks the support or resistance, then you get a signal for a new trend.
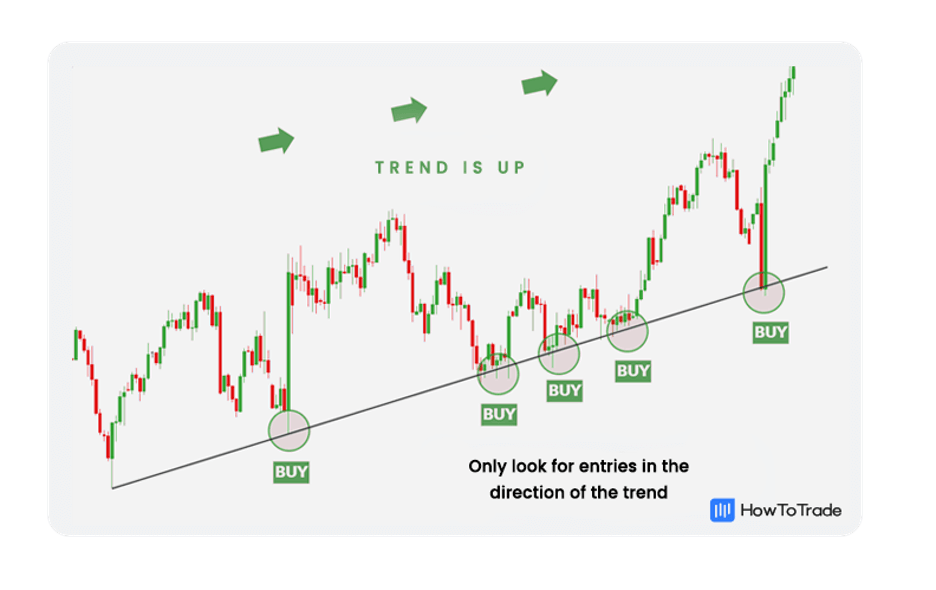
Another way to use support and resistance is during an ongoing trend. In this way, traders find a support or resistance level in an existing trend and find opportunities to enter a trade and join the trend.
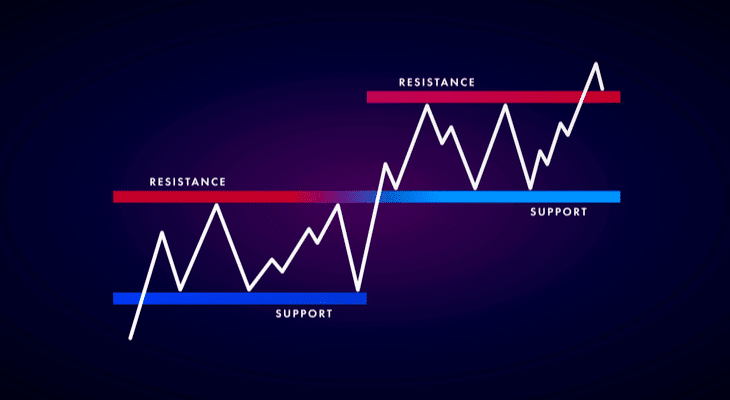
A picture, or well a zigzag pattern for us, paints a thousand words so let’s take a look at what Support and Resistance look like.

As you can see, support and resistance are basically horizontal lines on a price chart that are placed in areas where prices cannot break below or above these levels. Traders use this trading technique when they expect the price to stay inside the trading range or buy or sell the asset when the price breaks below or above the support or resistance level.
Drawing a Support Level
The support level can be spotted at the point on a chart where the stock prices stop falling (or, as traders say, the price reaches the bottom), change direction, and begin to rise.
Traders often refer to support as the ‘floor’ as it is the lowest level, the ground holding the stock prices from falling beneath it. Simply put, when you identify support levels at which prices cannot break below it at least twice, then this is a support level, and you draw a horizontal line using a drawing tool available on your trading platform.
Why Are Support Levels Important?
Support levels indicate where there will be a surplus of buyers for the specific stock or share, and these usually indicate exit or entry points for many traders.
At this point, you can expect to get an indication of the next price movement. If the price cannot break below the support level, you will buy the asset and join the trend. Otherwise, you will exit your trade or enter a short selling position if the stock’s price breaks the support level.

Drawing a Resistance Level
Resistance can be spotted at the point on a chart where the stock prices stop rising, change direction, and begin to fall. Traders often refer to resistance as the ‘ceiling’ that keeps the prices from rising higher.
Like a support level, you’ll have to draw a horizontal line or a trend line where prices cannot break a certain resistance level.
Why Are Resistance Levels Important?
Resistance levels indicate where there will be a surplus of sellers for the specific stock or share. The stronger the resistance, the smaller the chance that the downtrend will continue.
In other words, to make it even simpler, support levels suggest that the stock prices are unlikely to fall below the line, while resistance levels indicate that the stock prices are unlikely to rise above the line. Yet, when the price eventually breaks above a resistance level, you get a solid indication to enter a long position trade.

Why Should You Use Support and Resistance Levels?
Identifying Support and Resistance levels is crucial for your trading success. They are one of the most popular technical analysis tools amongst traders, and for a good reason (of not only the stock market but other financial markets too).
In fact, I could write 18 pages, front and back, on why support and resistance play a significant role in technical analysis. Also, if you are keen to expand your knowledge, you can find more information about support and resistance levels by reading one of the top trading books.
Now, to make it short and sweet before we are done, let me put it this way. Stock traders can more accurately predict future market movements by analyzing the support and resistance levels. Armed with this information, traders and investors can potentially find price levels (or price points) to enter or close a position.
The good thing with support and resistance is that it’s not complicated to use this tool, and it’s a reliable indicator. After all, many traders look at the same numbers and the same trading charts; therefore, these price levels become even more important when making trading decisions.
Further, many traders use level 2 order book, and order blocks to make this trading strategy successful.
How to Draw Support and Resistance Levels – A Step by Step Breakdown
Okay, so now that you know what support and resistance levels are, let’s take a look at how you can identify and draw them on price charts. So, here are the three steps to draw support and resistance levels with additional essential tips.
1. Open up your favorite chart type!
First, you need to open a trading chart on any financial instrument you want to focus on. Candlesticks, Bar Chart, or Line Chart – it’s entirely up to you to decide. Support and Resistance work with all. In our case, we will be using a Candlestick Chart.
2. Identify and draw horizontal lines at support and resistance levels
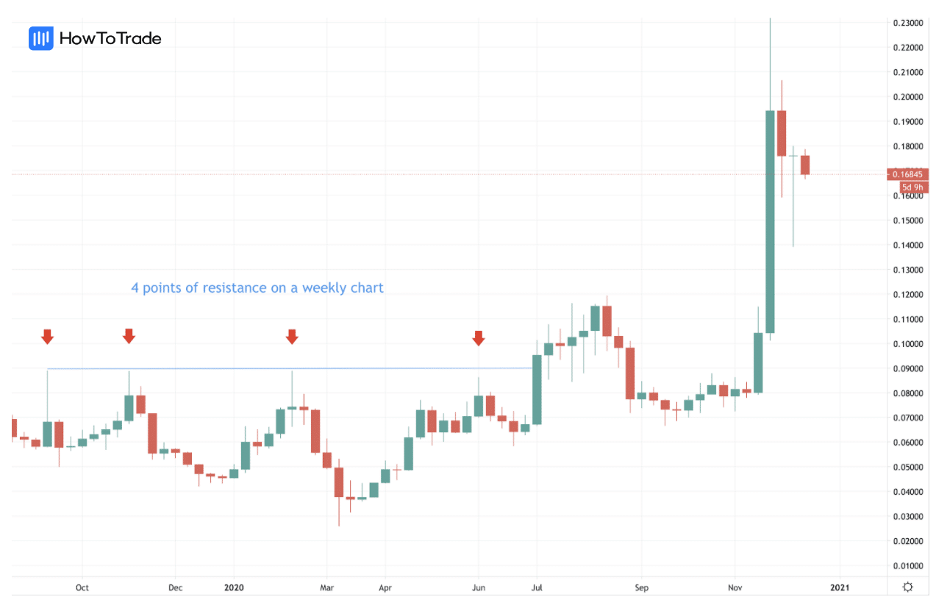
Now, you need to find support and resistance levels. To do that, you need areas where the price cannot break a certain level at least two times. But remember, the more, the better.
Then, on any advanced trading platform, you can notice you have drawing tools. To draw support and resistance levels, locate the drawing tool and use either a trend line or horizontal (depending on where you will draw support and resistance levels).
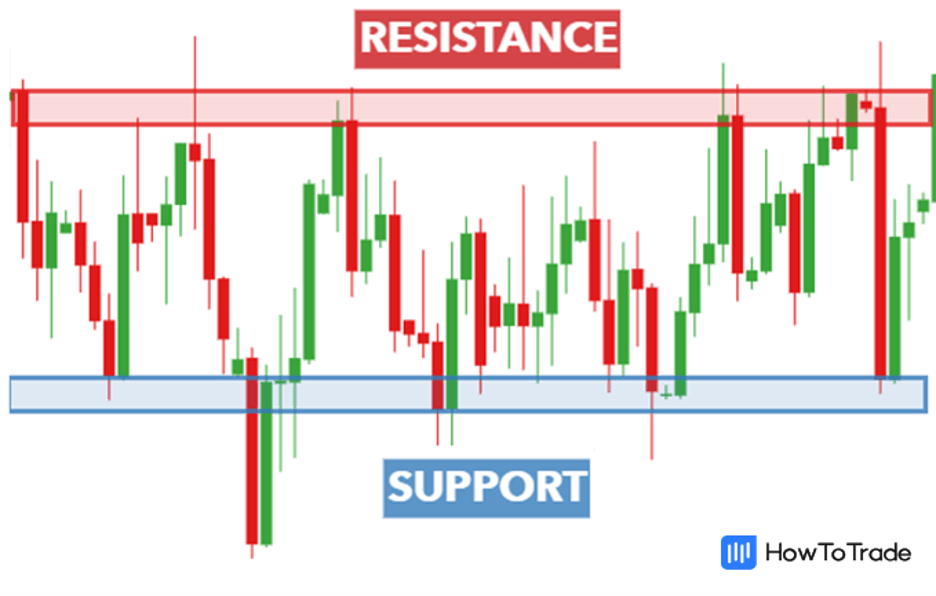
By drawing these lines, you can clearly see whether the market is in a trend or a range mode. To draw a horizontal line on your chart, select the horizontal line button on your toolbar and click anywhere on the chart where you want the line to appear. Eventually, your chart should look like this:

3. Trade stocks using support and resistance levels
Lastly, after you have identified support and resistance levels, it’s time to enter a trade. At basic, traders usually buy the asset near the support level and sell the asset near the resistance level. To be honest, it’s fairly simple.
Another common trading strategy is trading breakouts. In this case, you’ll enter a trade when the stock price breaks below or above the support and resistance levels.
Either way, there is one thing you need to keep in mind – placing a stop loss. The advantage of trading with support and resistance is that placing a stop order is clear and straightforward. You simply place your stop loss order below the support level or above the resistance level. Moreover, many traders use the stop level as an indicator to enter an opposite trade.
Summary
In conclusion, the concept of support and resistance zones (or levels) acts as a foundation for many advanced trading strategies in the stock market. As you can conclude from this lesson, there are various ways for technical traders to use these levels in their trading strategies, and it is entirely up to you to choose how and when you will use support and resistance levels.
As a tip – use this trading strategy. Support and resistance levels are among the most valuable trading tools a trader can use. It’s easy to use and highly reliable if you learn how to use it correctly.

