Heikin Ashi Charts in Forex [Explained]
In addition to the three most popular chart types we already discussed, there’s another type of price chart you should know about. It uses a different technique to display price action. It is called the Heikin Ashi, also known as the HA chart or the Heikin Ashi indicator.
But what is the Heikin Ashi technique, and how do you use it in your technical analysis strategy?
What is Heikin Ashi?
Heikin Ashi, also known as Heiken Ashi is a modified technical analysis candlestick charting technique used by traders to help them filter market noise and to predict trend direction in financial markets.
The Heikin Ashi indicator practically rearranges how the price is displayed on candlestick charts so traders can see more clearly whether to remain in a trade or exit. This can be attributed to Heikin Ashi candlesticks having different patterns and colors than traditional candlesticks. Consequently, due to the shape of Heikin Ashi candlesticks, many traders feel it is easier to predict price movement and, in particular, identify a trend reversal candlestick pattern.
The Heikin Ashi originated in Japan. In Japanese, Heikin means “average,” and Ashi means “pace.” So together, Heikin Ashi means “average pace of price” (or average bar).
Here’s an example of a Heikin Ashi chart.
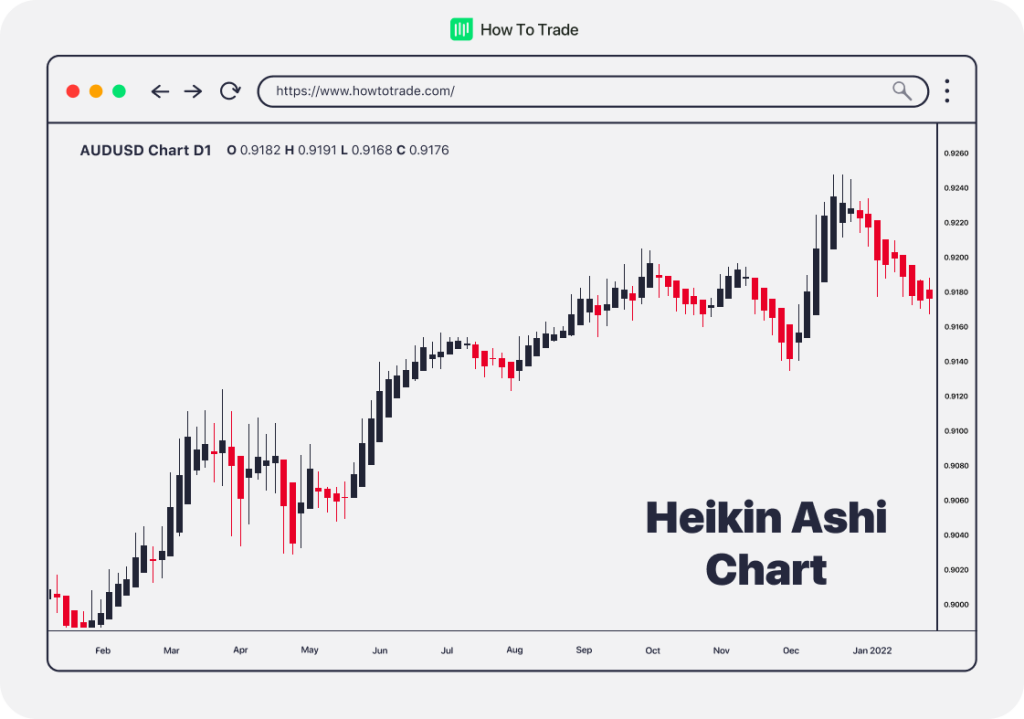
Looks familiar? But as you can see, Heikin Ashi candles have a different shape, and the price data is displayed differently than traditional charts.
The Difference Between Traditional Candlesticks and Heikin Ashi Candlesticks
To the untrained eye, the Heikin Ashi chart looks like a traditional Japanese candlestick chart. The former also has bodies with upper and lower shadows (or wicks). So, what’s the difference between a Heikin Ashi candlestick chart and a traditional Japanese candlestick chart?
Let’s show you through the charts below. The chart on the LEFT is the traditional Japanese chart, and the chart on the RIGHT is the Heikin Ashi chart.
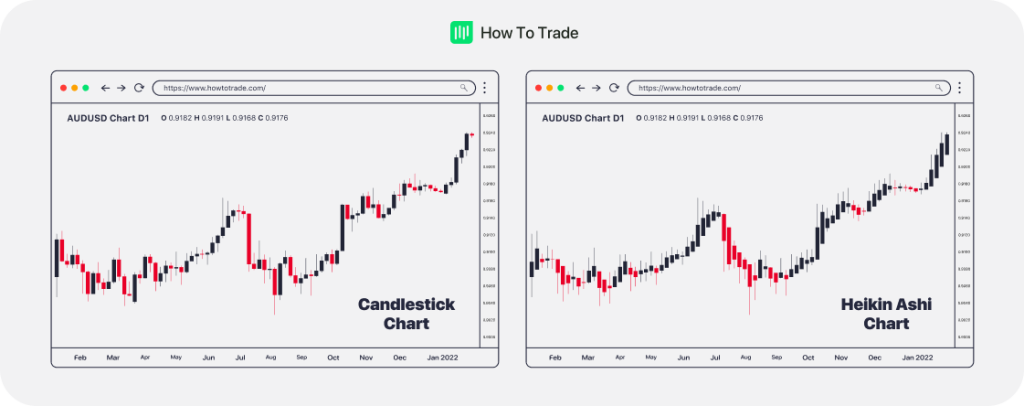
- As you can see from the chart on the right, directional moves are smoothed out in a way absent from the left chart. The candles on a traditional candlestick analysis chart frequently change from green to red (up or down) even in a strong downtrend or a strong uptrend. This makes them difficult to interpret. On the other hand, candles on the Heikin Ashi chart display more consecutive colored candles (no empty candles), making them more readable and easier for traders to get information about past price movements and identify a bullish or bearish trend.
- You’ll also notice that Heikin Ashi charts tend to have candles that stay green during an uptrend and red during a downtrend. This contrasts traditional candlestick charts, which alternate colors even if the price is moving strongly in one direction and the market trends are clear.
- It is also easier to see that the Heikin Ashi chart has a much smoother price action. This chart reduces the noise and allows traders to analyze trends more clearly. Another thing that makes Heikin Ashi different from a normal candlestick chart is how the price movement is displayed in terms of the open and the close.
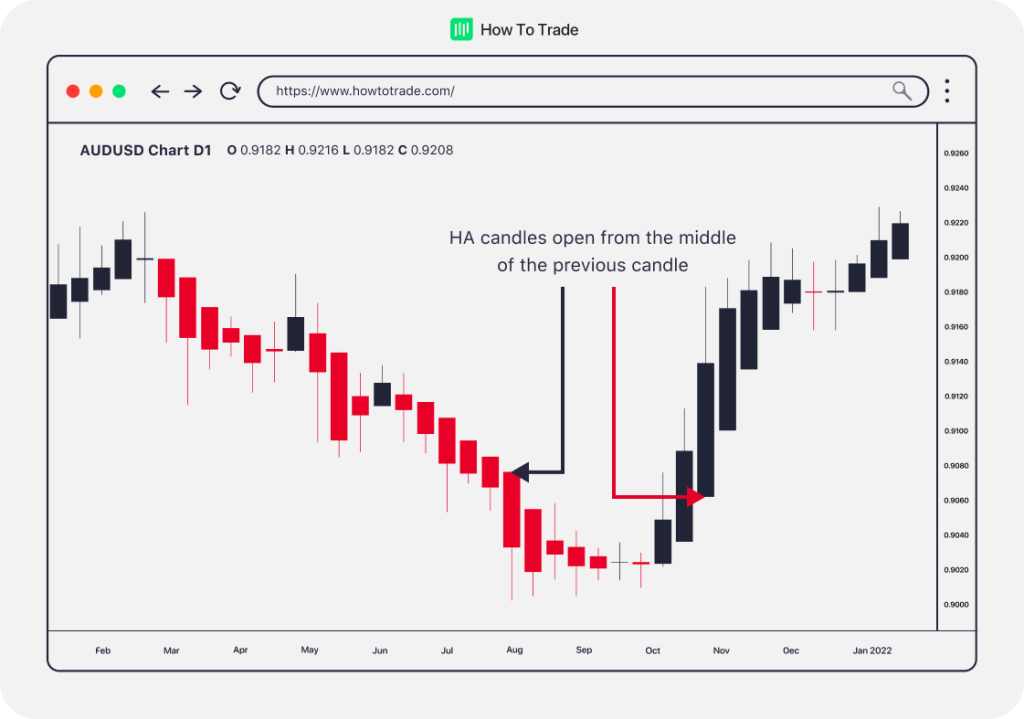
- Looking closely at the Heikin Ashi chart, you can see that each Heikin Ashi candlestick starts from the MIDDLE of the candlestick before it and not from the level where the previous candlestick had closed. This makes an obvious illustration of red and green candles; therefore, it is a better charting technique to find price momentum in the markets.
Let’s zoom in on the Heikin Ashi chart so you can see what we’re talking about.
Heikin Ashi candlesticks are formed this way on a trading chart due to the method used to calculate them. So, let’s move on to see how the Heikin Ashi formula works.
How to Calculate the Heikin Ashi
Heikin Ashi charts smooth price activity by calculating average price values.
An Heikin Ashi calculates its own open (Heikin Ashi open), high (Heikin Ashi high), low (Heikin Ashi low), and close (Heikin Ashi close) using the actual open (O), high (H), low (L) and close (C) of the time frame (1 minute, 5 minute, 15 minute, etc.).
To calculate the Heikin Ashi values, traders use the following formula.

Heikin Ashi Charts – Pros and Cons
Heikin Ashi charts have areas where they are simply the best charting option and some others where you’re better off using another chart.
Let’s see these advantages and disadvantages:
Advantages of Heikin Ashi Forex Chart
- Slows down the speed of the market, eliminating unnecessary false signals
- Filters out the effects of excess volatility – the market sentiment can be easily recognized
- Offers a clear view of the chart and price data
- It makes many false signals and retracements disappear, leaving you with rock-solid calls to action – easier to predict price trends and future price movement.
- Many forex traders prefer the Heikin Ashi forex chart as it smoothes out the price-action and market noise.
- Detects a strong trend that allows traders to stay in the trade without being nervous or making any unnecessary moves
Disadvantages of Heikin Ashi Forex chart
- It does not show true prices in comparison to other forex chart types
- Obscures actual price information
- Does not fit short-term and scalping strategies
- It may not be responsive enough for day traders or scalpers
- Not available on all trading platforms
Best for: Long-term position traders
Key Takeaways
- Heiken Ashi is a modified candlestick charting technique that helps filter market noise and predict trend direction in financial markets.
- They look like the usual Japanese candlesticks, but they are usually smoother.
- Heikin Ashi candles are also different in that they start from the midpoint of the candlestick before them, not the closing price level of the candles before them.
Conclusion
There’s a reason why Heikin Ashi candlestick charts have become so popular recently, especially among day traders and swing traders (although it could also be a great technique for position trading).
Many traders simply believe that the Heikin Ashi price data is much more accurate and easy to use than typical candlestick charts and that it helps them easily find entry and exit points.
Further, by removing the market noise, it is simply easier to get a sense of the market sentiment with HA charts and to realize whether there’s selling or buying pressure in a certain market.


Up To $5,000 Credit!
- Trade 1,000’s of global markets.
- 0% deposit and withdrawal fees.
- Rapid funding turn-around times.
- Trade on MetaTrader 4 and 5.