Federal Reserve Chair Jerome Powell’s comments on the need for “more good data” before cutting interest rates influenced market sentiment, balancing investor optimism with caution.
Key Points
- The S&P 500 closed at 5,587.83, up 0.08% yesterday, driven by gains in banking stocks.
- Today, the S&P 500 opened at 5,584.82 and is up 0.15% amid anticipation of further Fed testimonies and inflation data.
- The June CPI data on Thursday will shape expectations on Fed interest rate policies.
S&P 500 Daily Price Analysis – 10/07/2024
Yesterday, the S&P 500 closed at 5,587.83, up 0.08% from its opening price of 5,579.62. This modest increase marked the 36th record closing high for the index in 2024. The gains were largely driven by a rally in banking stocks, with JPMorgan and Goldman Sachs each rising over 1% ahead of their spring-quarter updates. Citigroup also saw a notable increase of nearly 3%, reflecting investor optimism about upcoming earnings reports and increased deal-making activities.
Federal Reserve Chair Jerome Powell’s comments to Congress played a significant role in market sentiment. Powell indicated that while inflation appears to be cooling, the Federal Reserve remains cautious about cutting interest rates too soon. His remarks underscored the need for “more good data” to ensure inflation is moving toward the Fed’s 2% target, which provided some reassurance to investors but also maintained a level of uncertainty about future monetary policy.
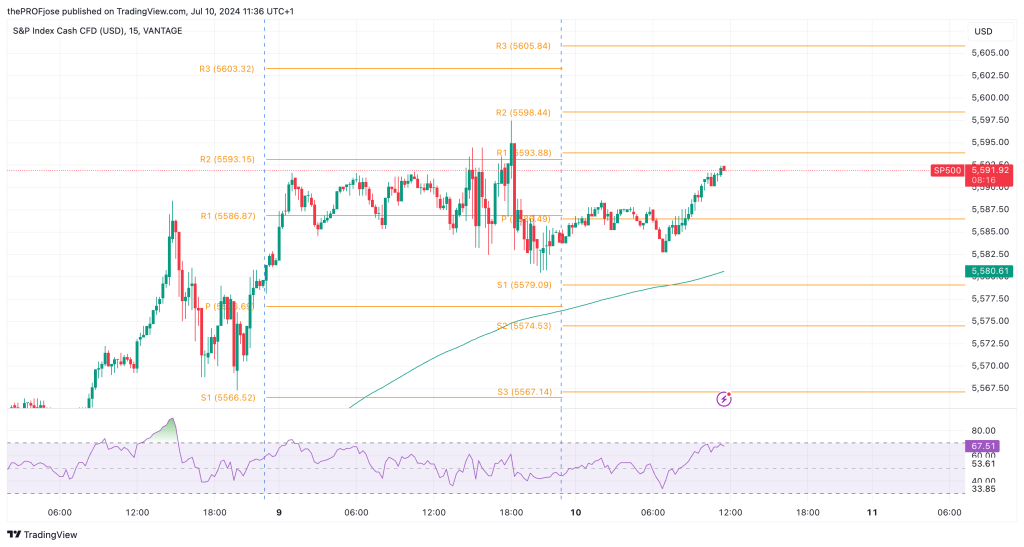
Today, the S&P 500 opened at 5,584.82 and is currently trading at 5,592.42, up 0.15%. This upward trend reflects continued investor confidence, bolstered by the anticipation of Powell’s further testimony and the upcoming release of key inflation data on Thursday. Market participants are closely watching these events as they could provide more clarity on the Fed’s policy direction and the broader economic outlook.
Key Economic Data and News to Be Released Today
The primary focus for today remains on Jerome Powell’s testimony before the House Financial Services Committee, which is expected to offer further insights into the Fed’s stance on inflation and interest rates. Additionally, speeches from other Fed officials, including Chicago Fed President Austan Goolsbee and Fed Governors Michelle Bowman and Lisa Cook, could provide more nuanced views on the economic landscape.
On the economic data front, the release of U.S. Crude Oil Inventories and Wholesale Inventories data will be closely monitored. Crude Oil Inventories are expected to show a significant increase, which could impact energy stocks and broader market sentiment. The Wholesale Inventories data, expected to rise by 0.6% for May, will provide additional context on supply chain dynamics and inventory management.
Looking ahead, the most anticipated economic release is the June Consumer Price Index (CPI) data scheduled for Thursday. Expectations are for a slight decline in inflation to 3.1% year-over-year, down from 3.3% in May. This data will be critical in shaping market expectations about the Fed’s next moves regarding interest rates and monetary policy.
S&P 500 Technical Analysis – 10/07/2024
The S&P 500 has been experiencing a bullish trend as evidenced by its movement above the 200 EMA. Also, at 67.51, the RSI is nearing overbought territory, suggesting that while the bullish momentum is strong, there may be a potential for a short-term pullback.

In the short term, the S&P 500 is likely to continue its upward trend, provided it can break through the immediate resistance at 5,593.88. If it succeeds, the index might rally toward the next resistance levels. However, given the RSI is close to overbought territory, there is a possibility of a short-term pullback or consolidation before the index continues its upward movement.
S&P 500 Fibonacci Key Price Levels 10/07/2024
Traders should keep a close eye on the following key price levels for the day:
| Support | Resistance |
| 5579.09 | 5593.88 |
| 5574.53 | 5598.44 |
| 5567.14 | 5605.84 |
Risk Disclosure: The information provided in this article is not intended to give financial advice, recommend investments, guarantee profits, or shield you from losses. Our content is only for informational purposes and to help you understand the risks and complexity of these markets by providing objective analysis. Before trading, carefully consider your experience, financial goals, and risk tolerance. Trading involves significant potential for financial loss and isn't suitable for everyone.


