October’s PCE inflation data met expectations but signaled stalled progress toward the Federal Reserve’s 2% target, reinforcing hawkish monetary policy.
Key Points
- The S&P 500 rose 0.05% today after gaining 0.26% on Thursday.
- Tech stock losses led Wednesday’s pullback after November’s rally.
- No major U.S. data today; focus shifts to global news.
S&P 500 Daily Price Analysis – 29/10/2024
As of Friday, the S&P 500 index is trading at 6,025.00, reflecting a modest increase of 0.05% from its opening price of 6,020.70. This slight uptick follows Thursday’s close at 6,021.92, which marked a 0.26% gain from the previous day’s opening of 6,007.50.
The U.S. stock market is reopening today for a shortened session after the Thanksgiving holiday, with many investors still on vacation. On Wednesday, the market experienced a pullback, with the Dow Jones Industrial Average declining by 0.31%, the S&P 500 by 0.38%, and the Nasdaq Composite by 0.59%. This downturn was largely due to profit-taking following a robust rally earlier in November.
Technology stocks were the primary contributors to Wednesday’s decline. Major tech companies such as Nvidia, Tesla, Microsoft, Amazon, and Meta Platforms saw their stock prices decrease by 1.2%, 1.6%, 1.2%, 1%, and 0.8%, respectively. Additionally, Dell Technologies and HP faced significant losses of 12.3% and 11.4%, respectively, attributed to disappointing PC sales and weak forward guidance.
On the economic front, the PCE price index for October, the Federal Reserve’s preferred inflation gauge, rose by 0.2% month-over-month, while the core PCE increased by 0.3%. These figures met market expectations but indicate that progress toward the Fed’s 2% inflation target has stalled, potentially supporting a more hawkish monetary policy stance.
Key Economic Data and News to Be Released Today
Given the holiday-shortened week, no major U.S. economic data releases are scheduled for today. As a result, significant movements in the S&P 500 are unlikely to be driven by economic data. Investors may instead focus on global economic developments and any unexpected news events.
S&P 500 Technical Analysis – 29/10/2024
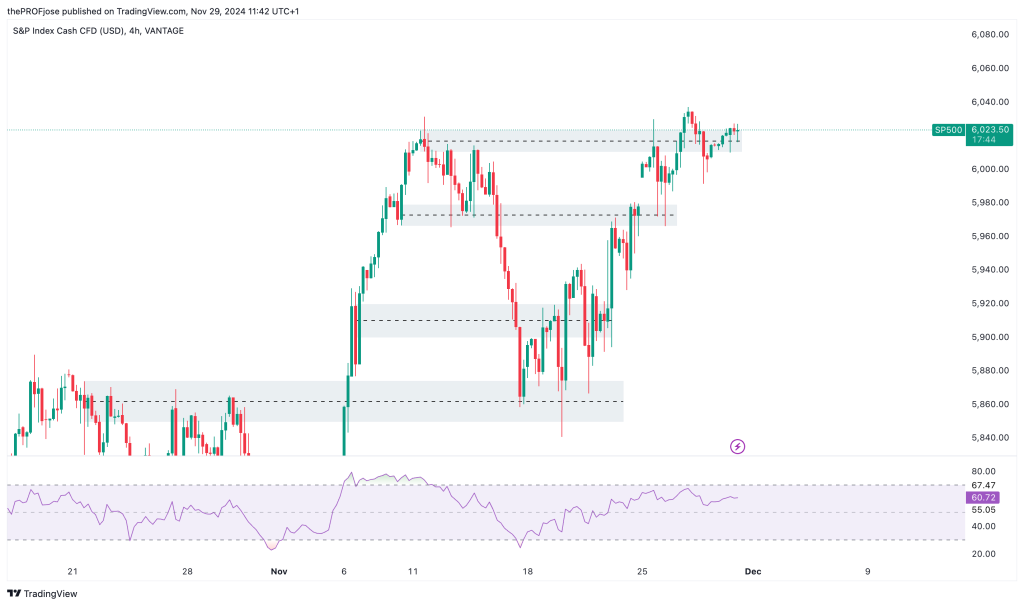
On the technical analysis front, the S&P 500 is printing a textbook bullish setup today. From the higher timeframe to the lower timeframe, we have a beautiful price action developing. Let’s take a quick look at it.

On the 4-hour timeframe, as shown in the chart above, we can see how price has beautifully reacted and respected resistance-turned-support zones in the past and we are seeing price about to repeat the same thing again. Currently, price is forming a bullish pin bar candlestick pattern inside of our point of interest, we can expect a bullish move to follow.
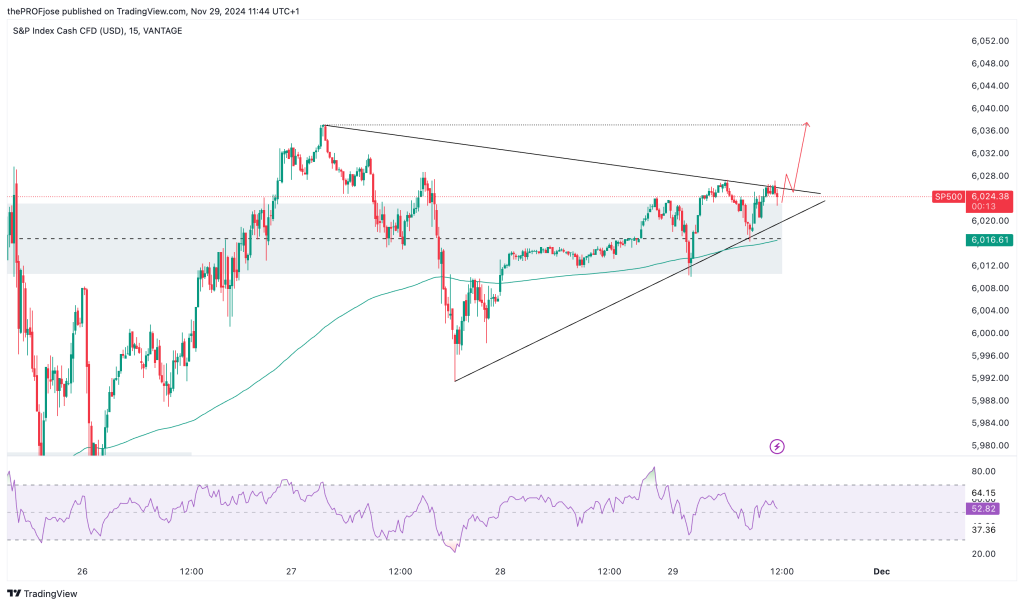
Knowing our bias from the higher timeframe, we can now scale down to the 15-minute chart to look for entry.

On the 15-minute chart, notice that the price is struggling to break out of the symmetrical triangle chart pattern while also trending above the 200 EMa, with the RSI showing enough room for the price to climb up. This is a picture perfect BUY position. Buyers should position themselves to go long after a decisive breakout of the upper trendline, targeting the swing high.
S&P 500 Fibonacci Key Price Levels 29/10/2024
Traders should keep a close eye on the following key price levels for the day:
| Support | Resistance |
| 6010.95 | 6024.36 |
| 6006.81 | 6028.50 |
| 6000.11 | 6035.21 |
Risk Disclosure: The information provided in this article is not intended to give financial advice, recommend investments, guarantee profits, or shield you from losses. Our content is only for informational purposes and to help you understand the risks and complexity of these markets by providing objective analysis. Before trading, carefully consider your experience, financial goals, and risk tolerance. Trading involves significant potential for financial loss and isn't suitable for everyone.


