
The Nasdaq 100 continues to face strong headwinds, driven by a sharp selloff in tech and semiconductor stocks, with mounting economic concerns amplifying the pressure on the index.
Key Points
- The Nasdaq 100 fell 3.14% on Tuesday and continued down 0.77% today.
- Losses in semiconductor stocks, led by NVIDIA, drove the decline amid weak PMI data.
- AI-related earnings concerns and poor forecasts from Zscaler worsened market sentiment.
NASDAQ 100 Daily Price Analysis – 04/09/2024
The NASDAQ 100 continued to drop after a big decline on Tuesday, closing at 19,006.50, which is a 3.14% drop from its opening price of 19,599.00. Today, the index is trading even lower at 18,859.50, down 0.77% from this morning’s opening of 18,993.75. This selloff is mostly due to big losses in companies that make chips, raising concerns about the overall economy and the future of certain tech industries.
Tuesday’s steep decline in the Nasdaq was primarily influenced by heavy losses in semiconductor stocks, with NVIDIA leading the downturn, plummeting by 8.7%. Other chip makers like Intel, Micron, and AMD also faced substantial selling pressure. This wave of selloffs was triggered by weak PMI reports, reflecting a contraction in manufacturing, which exacerbated fears over the health of the U.S. economy.
Investors are especially nervous about the future earnings of companies in AI, including the major sell-off in NVIDIA stock, which was one of the big reasons for the stock rally this year. Adding to the problem, disappointing forecasts from companies like Zscaler, whose stock dropped 15%, worsened market sentiment.
Key Economic Data and News to Be Released Today
Today, investors will be watching the JOLTS job openings data, which will give hints about how strong the job market is, especially since last month showed some weaknesses. Traders are also keeping an eye on factory orders and the Fed’s Beige Book, two reports that could change what people expect the Federal Reserve to do with interest rates. Many believe that if these reports are weak, the Fed might cut rates by 25 basis points, which could affect the market even more.
Later this week, other important reports like the ISM Non-Manufacturing PMI and Non-Farm Payrolls could bring more volatility to the market. If the job market or the economy continues to show weakness, it could make the Fed more likely to make bigger cuts, adding more uncertainty to the Nasdaq 100.
NAS100 Technical Analysis – 04/09/2024
On the 15-minute timeframe, the Nasdaq 100 is displaying a clearly bearish trend, with the price consistently trading below the 200 EMA. The RSI has crossed below the key level of 50, indicating further bearish momentum. Historically, when the Nasdaq 100 moves below the 200 EMA with a weak RSI, it often signals a continuation of the downward trend, especially when combined with external factors like negative economic data.
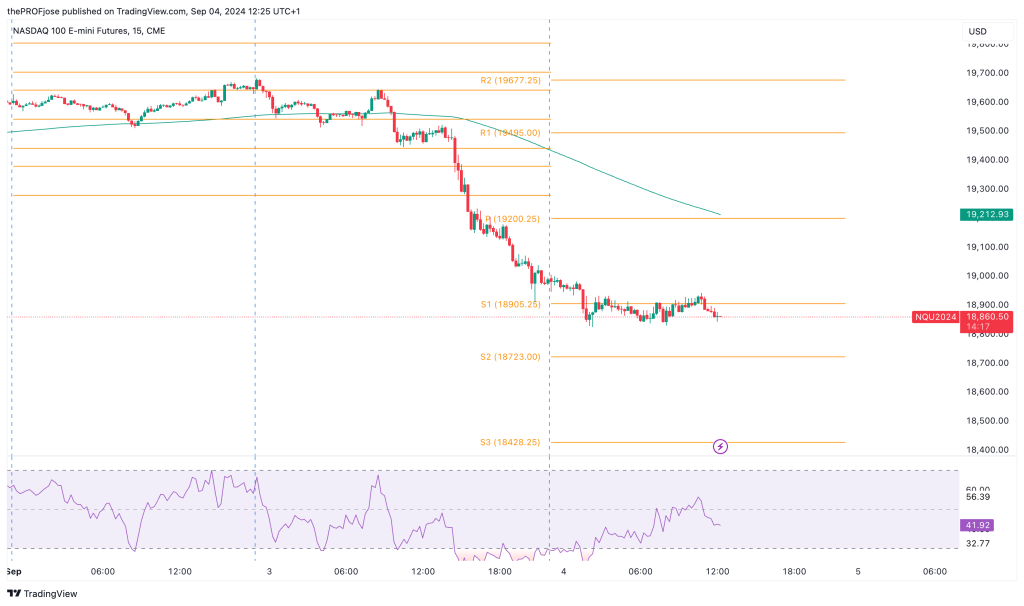
If the current price breaks below the consolidation zone, the Nasdaq 100 could test major support levels at 18,905.25 and 18,723.00. These levels have provided support in the past, but with ongoing concerns about the economy and upcoming reports, there’s a risk that the price could drop further, speeding up the bearish movement.
In the short term, traders should look out for a bearish breakout, especially if today’s economic reports don’t meet expectations. If the index breaks below 18,723.00, the next target could be around 18,428.25. On the flip side, if the price moves back above the 200 EMA, there could be a short-term rally, but it’s unlikely to last unless there’s some positive news to support it.
NASDAQ100 Fibonacci Key Price Levels 04/09/2024
The technical setup suggests a cautious approach as the index is testing critical support levels. In view of this, here are some critical support and resistance levels to pay attention to:
| Support | Resistance |
| 18905.25 | 19495.00 |
| 18723.00 | 19677.25 |
| 18428.25 | 19972.25 |
Risk Disclosure: The information provided in this article is not intended to give financial advice, recommend investments, guarantee profits, or shield you from losses. Our content is only for informational purposes and to help you understand the risks and complexity of these markets by providing objective analysis. Before trading, carefully consider your experience, financial goals, and risk tolerance. Trading involves significant potential for financial loss and isn't suitable for everyone.