
Investors are focused on Jerome Powell’s speech, with a 74% chance of a 25-basis-point rate cut priced in, though uncertainty remains high.
Key Points
- Yesterday, Nasdaq 100 closed down 1.66% amid concerns ahead of the Jackson Hole Symposium.
- The index is up 0.80% today, driven by optimism about potential Fed rate cuts.
- New home sales data today could impact market sentiment.
NASDAQ 100 Daily Price Analysis – 23/08/2024
The Nasdaq 100 closed yesterday at 19,578.25, down 1.66% from its opening price of 19,921.25. This decline reflected broader market concerns as traders positioned themselves ahead of the Jackson Hole Symposium, where Federal Reserve Chair Jerome Powell is expected to provide key insights on the future direction of U.S. monetary policy. The index faced additional pressure from a tech sell-off, particularly in semiconductor and software stocks, contributing significantly to the overall decline.
As of the current trading day, the Nasdaq 100 has rebounded slightly, opening at 19,621.50 and currently trading at 19,731.00, up 0.80%. This recovery is largely driven by investor optimism ahead of Powell’s speech, with expectations leaning towards a potential rate cut in September, which has historically been supportive of tech stocks. Additionally, the anticipation of strong earnings reports from major tech companies has contributed to today’s uptick.
Key Economic Data and News to Be Released Today
For now, all eyes are on Powell’s upcoming speech at the Jackson Hole Symposium. Markets are closely watching for any hints about the pace and magnitude of potential rate cuts, with futures pricing in a 74% chance of a 25-basis-point cut in September. However, there remains a significant level of uncertainty, especially if Powell chooses a more hawkish tone, which could dampen today’s gains.
Later today, the release of new home sales data for July could further influence market sentiment. If the data shows stronger-than-expected results, it might bolster the case for a more gradual easing of interest rates, potentially supporting further gains in the Nasdaq 100. Conversely, weaker data could reinforce concerns about economic slowdown, which might reignite volatility in the markets.
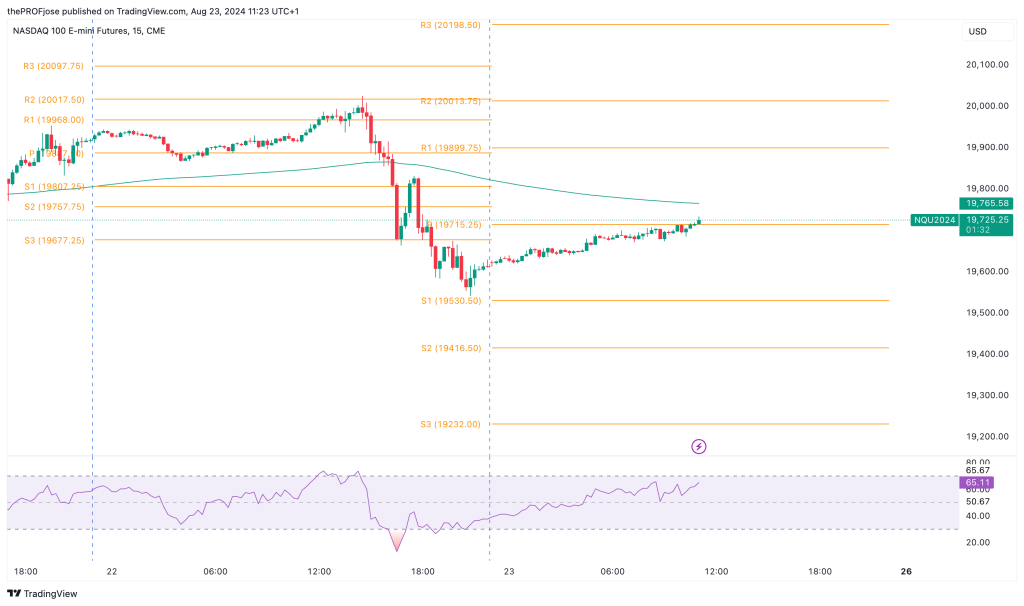
NAS100 Technical Analysis – 23/08/2024
The Nasdaq 100 is currently in a downtrend, as indicated by the price trading below the 200 EMA. The failure to break above this critical level during the session confirms the ongoing bearish pressure in the market.
In the short term, the Nasdaq 100 is likely to remain under pressure as long as it trades below the 200 EMA. The market appears to be in a consolidation phase following the recent decline, with the potential for further downside if the support levels fail to hold. However, if the index manages to break above the 200 EMA, it could trigger a bullish continuation, targeting the next resistance levels.
NASDAQ100 Fibonacci Key Price Levels 23/08/2024
The technical setup suggests a cautious approach as the index is testing critical support levels. In view of this, here are some critical support and resistance levels to pay attention to:
| Support | Resistance |
| 19530.50 | 19899.75 |
| 19416.50 | 20013.75 |
| 19232.00 | 20198.50 |
Risk Disclosure: The information provided in this article is not intended to give financial advice, recommend investments, guarantee profits, or shield you from losses. Our content is only for informational purposes and to help you understand the risks and complexity of these markets by providing objective analysis. Before trading, carefully consider your experience, financial goals, and risk tolerance. Trading involves significant potential for financial loss and isn't suitable for everyone.