Yesterday, Nasdaq 100 fell significantly by 3.62% due to disappointing earnings from major tech companies Tesla and Alphabet.
Key Points
- Tesla’s profits fell 45%, causing its stock to decline by 10.8%, while Alphabet’s stock dropped 5.1% due to high AI costs and weak YouTube performance.
- The index opened lower today, with a slight decline of 0.47%, indicating cautious market sentiment.
- Key upcoming economic data, including durable goods orders and Q2 GDP estimates, will impact market expectations for Federal Reserve rate cuts.
NASDAQ 100 Daily Price Analysis – 25/07/2024
The Nasdaq 100 faced a significant decline on the previous trading day, closing at 19,203.25, a drop of 3.62% from the open of 19,883.00. This decline was primarily driven by disappointing earnings reports from major tech companies Tesla and Alphabet, which heavily influenced market sentiment. Tesla’s earnings missed expectations, with a 45% drop in profits, leading to a 10.8% fall in its stock price.
Alphabet also saw a 5.1% decline as investors reacted negatively to high spending on AI and a weaker-than-expected performance from YouTube. This collective underperformance among key tech stocks, often referred to as the “Magnificent Seven,” contributed to the largest single-day loss in the Nasdaq 100 since 2022.
As of the current trading day, the Nasdaq 100 opened at 19,260.00 and is trading at 19,116.00, reflecting a slight decline of 0.47%. The market remains cautious as investors digest the latest earnings reports and prepare for more economic data. The mixed performance in premarket trading for tech giants like Apple, Nvidia, and Meta indicates a cautious market sentiment, with some investors remaining optimistic about certain stocks while others are hesitant.
Key Economic Data and News to Be Released Today
Today’s focus shifts to upcoming economic data, including durable goods orders, Q2 GDP estimates, and weekly jobless claims. These reports will be crucial in shaping market expectations regarding the Federal Reserve’s monetary policy, particularly concerning potential interest rate cuts.
The market is currently pricing in a high probability of rate cuts later in the year, with the Personal Consumption Expenditures (PCE) price index data due on Friday being a key determinant. This data will provide insights into inflation trends and the health of the consumer sector, which are critical factors for the broader economic outlook.
NAS100 Technical Analysis – 25/07/2024
The Nasdaq 100 index has been trending downward, as indicated by the price action below the 200 EMA. Also, the current RSI level suggests that there may still be room for further declines before reaching an oversold condition, which could attract buyers.
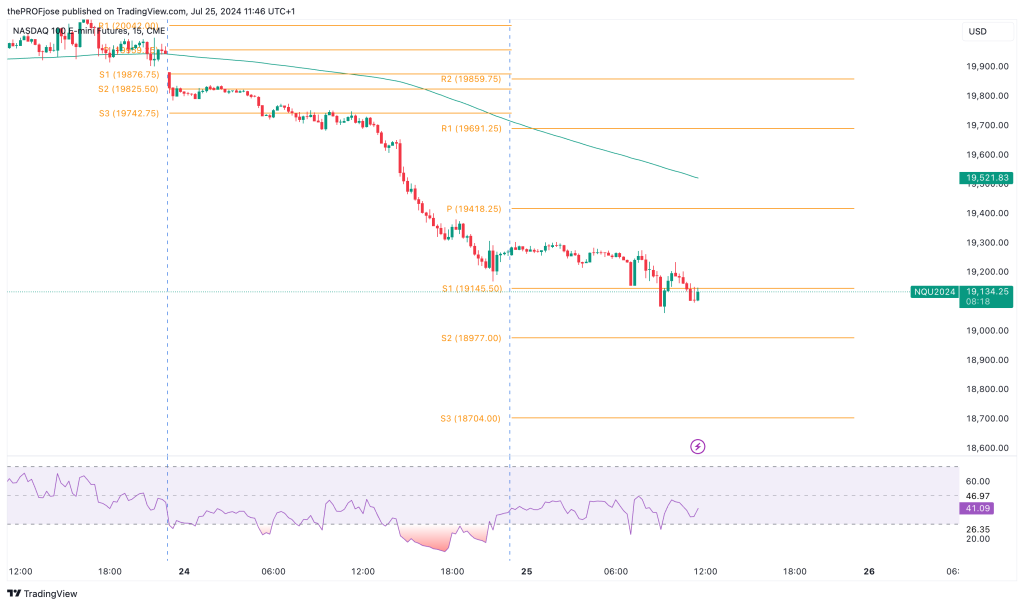
Given the strong downward momentum and the market trading below the 200 EMA, the short-term outlook for the Nasdaq 100 remains bearish. The index is likely to test the support levels, particularly S1 and possibly S2, if the selling pressure continues. However, if there is a positive shift in sentiment or better-than-expected economic data, we could see a rebound towards the resistance levels, though this would require a significant catalyst.
NASDAQ100 Fibonacci Key Price Levels 25/07/2024
The technical setup suggests a cautious approach as the index is testing critical support levels. In view of this, here are some critical support and resistance levels to pay attention to:
| Support | Resistance |
| 19145.50 | 19691.25 |
| 18977.00 | 19859.75 |
| 18704.00 | 20132.50 |
Risk Disclosure: The information provided in this article is not intended to give financial advice, recommend investments, guarantee profits, or shield you from losses. Our content is only for informational purposes and to help you understand the risks and complexity of these markets by providing objective analysis. Before trading, carefully consider your experience, financial goals, and risk tolerance. Trading involves significant potential for financial loss and isn't suitable for everyone.