The Dow Jones Industrial Average (US 30) closed at an all-time high of 40,990.10 yesterday, up 1.79%, driven by strong corporate earnings and better-than-expected retail sales data for June.
Key Points
- UnitedHealth Group surged 6.5% on strong Q2 results, while Charles Schwab fell due to disappointing sales.
- DJIA opened at 41,004.67 but dropped slightly to 40,912.92, indicating profit-taking and consolidation.
- No major economic reports today; tomorrow’s unemployment claims data may impact the market.
Dow Jones Daily Price Analysis – 17/07/2024
The Dow Jones Industrial Average closed at an all-time high of 40,990.10 yesterday, marking a significant 1.79% increase from the previous day’s open of 40,288.55. This robust performance was largely driven by strong corporate earnings and the release of better-than-expected retail sales data for June. Industrial sectors led the gains, while communication services and technology stocks lagged.
UnitedHealth Group saw a substantial 6.5% increase following its impressive second-quarter results, making it the top performer on the Dow. In contrast, Charles Schwab experienced a steep decline due to disappointing sales figures.
As of the current trading day, the Dow opened at 41,004.67 but has experienced a slight decline, trading at 40,912.92, down by 0.19%. This minor pullback comes after the previous day’s rally and reflects some profit-taking and market consolidation. The economic backdrop remains influential, with Federal Reserve Chair Jerome Powell’s recent comments hinting at possible rate cuts before inflation hits the 2% target, maintaining market optimism. However, the unexpected decline in US homebuilder confidence due to higher mortgage and construction loan rates adds a cautious note to the market sentiment.
Key Economic Data and News to Be Released Today
There are no high-impact economic reports scheduled for today. However, investors are looking ahead to tomorrow’s unemployment claims data, which could provide more insights into the labor market’s health and influence future market movements. The market will also closely monitor any developments in bond yields, as fluctuations could impact the DJIA’s trajectory. The 10-year Treasury yield fell by seven basis points to 4.16% yesterday, which was bullish for equities, but further changes could sway market sentiment.
Dow Jones Technical Analysis – 17/07/2024
From a technical analysis perspective, the current price (40,923.67) is well above the 200 EMA. This suggests that the market is in a bullish phase, with the EMA acting as a dynamic support level.
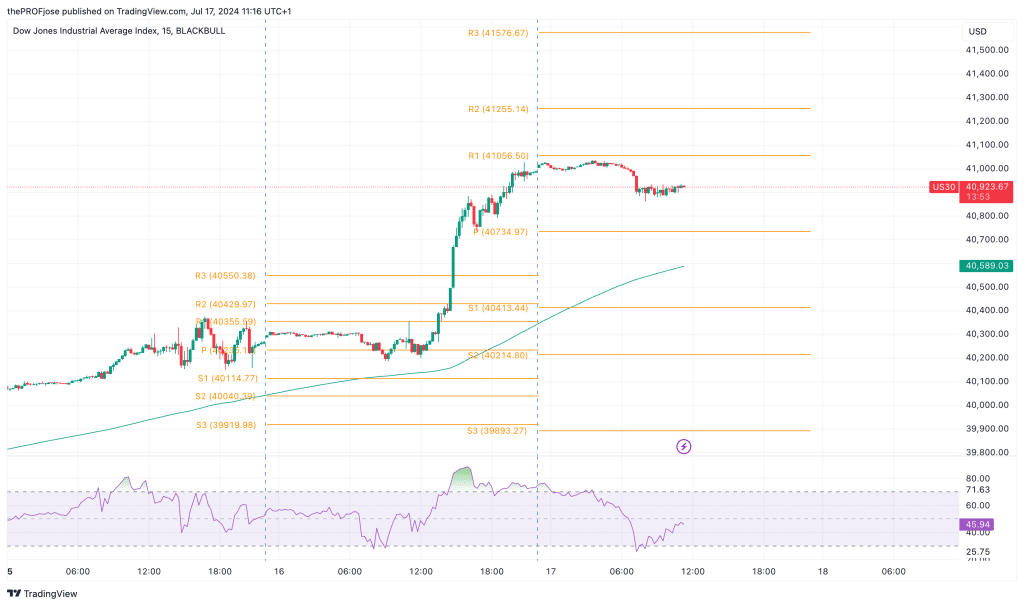
Given the current bullish trend and the market’s position above the 200 EMA, the short-term outlook remains positive. However, with the RSI at neutral levels, there is a likelihood of sideways movement or mild correction before the next upward push. Traders should watch for a break above the immediate resistance at 41,056.50 to confirm the continuation of the bullish trend. On the downside, a break below the 200 EMA could indicate a trend reversal or a deeper correction.
Dow Jones Fibonacci Key Price Levels 17/07/2024
Short-term traders planning to invest in US 30 today should keep a close eye on the following key price levels for the day:
| Support | Resistance |
| 40413.44 | 41056.50 |
| 40214.80 | 41255.14 |
| 39893.27 | 41576.67 |
Risk Disclosure: The information provided in this article is not intended to give financial advice, recommend investments, guarantee profits, or shield you from losses. Our content is only for informational purposes and to help you understand the risks and complexity of these markets by providing objective analysis. Before trading, carefully consider your experience, financial goals, and risk tolerance. Trading involves significant potential for financial loss and isn't suitable for everyone.