The Nikkei 225 rose by 0.48%, led by strong performances in electronics stocks, offsetting U.S. trade and inflation uncertainties.
Key Points
- USD/JPY rebounded 0.58% to 151.886, recovering from Wednesday’s 1.30% drop on BoJ rate hike hopes.
- Dollar index rose 0.11%, with markets pricing a 65% chance of a December Fed rate cut.
- Geopolitical tensions and thin holiday trading kept investor caution high.
USD/JPY Daily Price Analysis – 28/11/2024
USD/JPY rebounded by 0.58% today, currently trading at 151.886 after opening at 151.108. This follows a sharp decline of -1.30% on Wednesday, with the pair closing at 151.117 after reaching an earlier high of 153.089. The yen has demonstrated relative strength this week, bolstered by growing expectations of a potential rate hike by the Bank of Japan in the near term.
Japanese equities closed higher today also. For instance, the Nikkei 225 gained 0.48% to settle at 38,349.06, driven by electronics stocks such as Tokyo Electron Ltd. (+6.7%) and NEC (+2.3%). Optimism surrounding potential Federal Reserve rate cuts in 2024 helped offset concerns over U.S. trade policy and inflation risks.
On the other hand, the dollar index edged up 0.11% to 106.23, retracing losses from the previous session as traders processed mixed economic signals. While October consumer spending outpaced expectations, inflation remains stubbornly above the Federal Reserve’s 2% target, clouding the outlook for rate cuts. Market participants are pricing in a 65% chance of a December rate cut by the Fed, with doubts lingering on whether inflation will sustainably trend downward.
Minutes from the Federal Reserve’s latest meeting revealed diverging views on the extent of further rate cuts. While a 25-basis-point cut in December remains the consensus, continued core inflation pressures could temper dovish expectations. This cautious outlook has buoyed USD/JPY, which typically benefits from higher U.S. yields.
Rising geopolitical tensions, including recent developments in Ukraine, have further contributed to a cautious tone in global markets. Investors are hesitant to take large positions as the Thanksgiving holiday limits trading volumes.
Key Economic Data and News to Be Released Today
Today’s economic calendar is relatively light with no major data releases expected that could significantly impact USD/JPY movement. However, traders will remain attuned to geopolitical developments, shifts in U.S. trade policies, and commentary from central bank officials in the U.S. and Japan.
USD/JPY Technical Analysis – 28/11/2024
If you are quite familiar with chart patterns, you can easily tell where USD/JPY may be headed in a couple of days. Let’s check it out together.

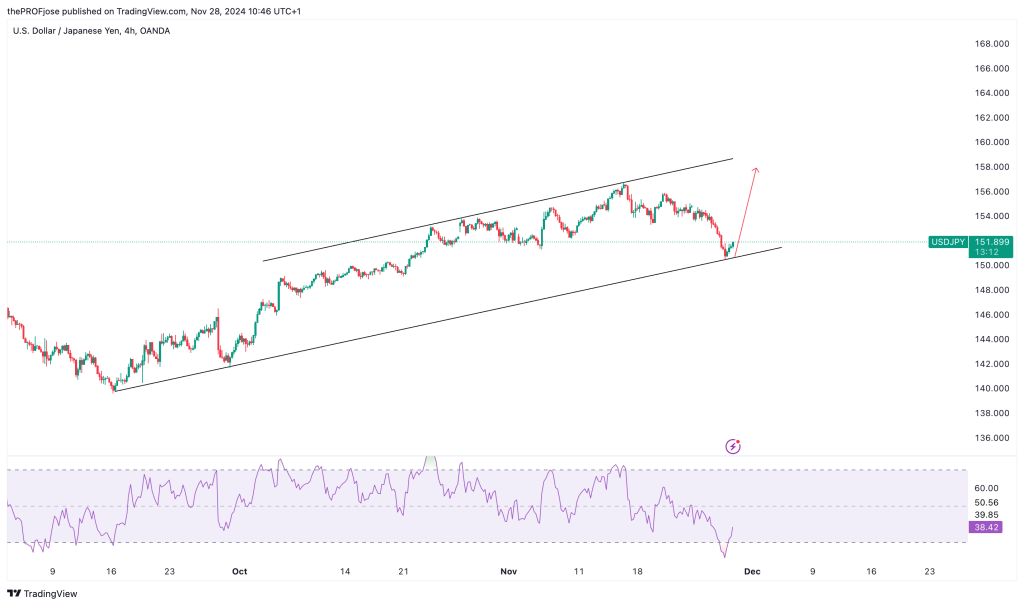
As seen in the 4-hour chart above, the pair is in a rising price channel, and has just reacted on the lower trendline. So, we are expecting the price to go all the way up to either a key resistance level or the upper trendline. One more interesting thing to note is that the RSI also shows that price is oversold, hence giving us an additional confluence to look for long positions.
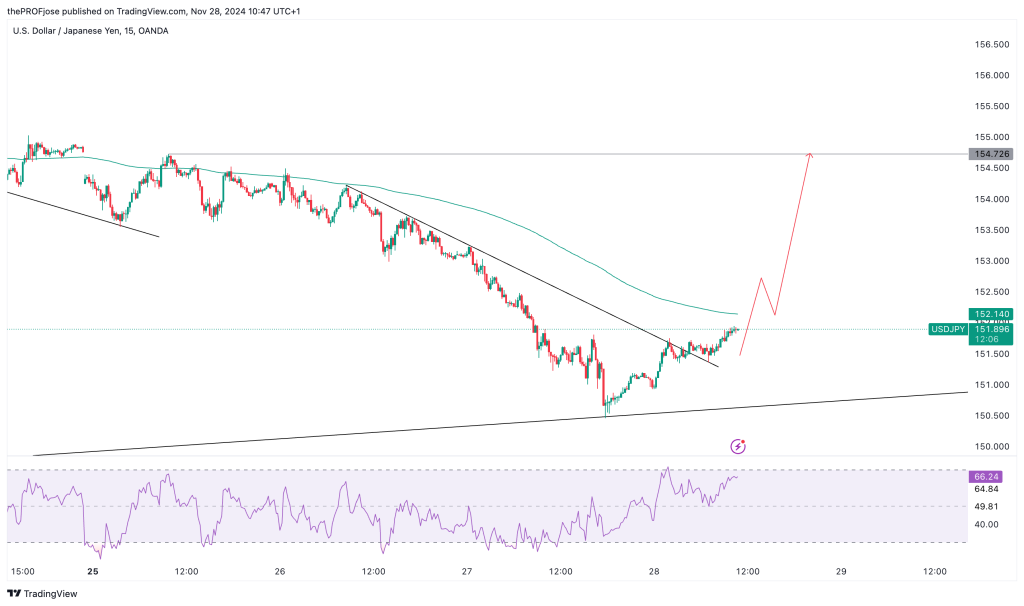
Now, let’s take a closer look at where the lower timeframe price action is leading us. On the 15-minute chart, price has already breakout of a bearish trendline as seen in the chart below:

While some traders can jump on a BUY trade immediately after the breakout, it’s safer to wait till price close above the 200 EMA before taking the trade as this allows us to confirm the change of momentum from bearish to bullish before committing to the position.
USD/JPY Fibonacci Key Price Levels 28/11/2024
Short-term traders planning to invest in USD/JPY today should keep a close eye on the following key price levels for the day:
| Support | Resistance |
| 150.540 | 152.666 |
| 149.883 | 153.323 |
| 148.820 | 154.386 |
Risk Disclosure: The information provided in this article is not intended to give financial advice, recommend investments, guarantee profits, or shield you from losses. Our content is only for informational purposes and to help you understand the risks and complexity of these markets by providing objective analysis. Before trading, carefully consider your experience, financial goals, and risk tolerance. Trading involves significant potential for financial loss and isn't suitable for everyone.


