President-elect Trump’s tariff announcements have weakened the USD, with the dollar index hitting its lowest since November 20.
Key Points
- GBP/USD shows resilience, gaining 0.36% today to 1.26152 after a range-bound session yesterday.
- The Bank of England’s cautious approach to rate cuts suggests GBP outperformance against EUR.
- Today’s PCE index and durable goods orders data are pivotal for gauging inflation trends and potential shifts in Federal Reserve policy.
GBP/USD Daily Price Analysis – 27/11/2024
The British Pound has demonstrated resilience against the U.S. Dollar in recent trading sessions. On Tuesday, GBP/USD closed at 1.25690, marking a marginal increase from the previous day, with a trading range between 1.25072 and 1.26165. As of today, the pair opened at 1.25722 and has risen to 1.26152, reflecting a 0.36% gain.
The Bank of England maintains higher interest rates compared to other G-10 central banks. Analysts note that the BoE’s cautious approach to rate cuts aligns more closely with the Federal Reserve’s stance, contrasting with the European Central Bank’s more aggressive rate reduction expectations. This positioning suggests potential outperformance of the GBP against the EUR, with projections of EUR/GBP declining to 0.83 by year-end.
Moreover, President-elect Donald Trump’s recent announcements of significant tariffs on imports from Canada, Mexico, and China have introduced market uncertainty. These measures have led to a depreciation of the USD as investors reassess the potential economic implications. The dollar index has declined, reaching its lowest point since November 20.
The BoE remains vigilant about elevated inflation levels, which may influence its monetary policy decisions. In contrast, the U.S. administration’s tariff strategies could exacerbate inflationary pressures, potentially limiting the Federal Reserve’s capacity to implement further rate cuts.
Key Economic Data and News to Be Released Today
Scheduled for release today, the PCE index is a key inflation measure closely watched by the Federal Reserve. Analysts anticipate the core PCE to increase by 0.3% month-over-month and 2.8% year-over-year. This data will provide insights into consumer spending and inflation trends. Market participants will analyze this data to gauge inflationary pressures and potential monetary policy responses.
Data on durable goods orders will also provide insights into manufacturing activity and business investment.
GBP/USD Technical Analysis – 27/11/2024
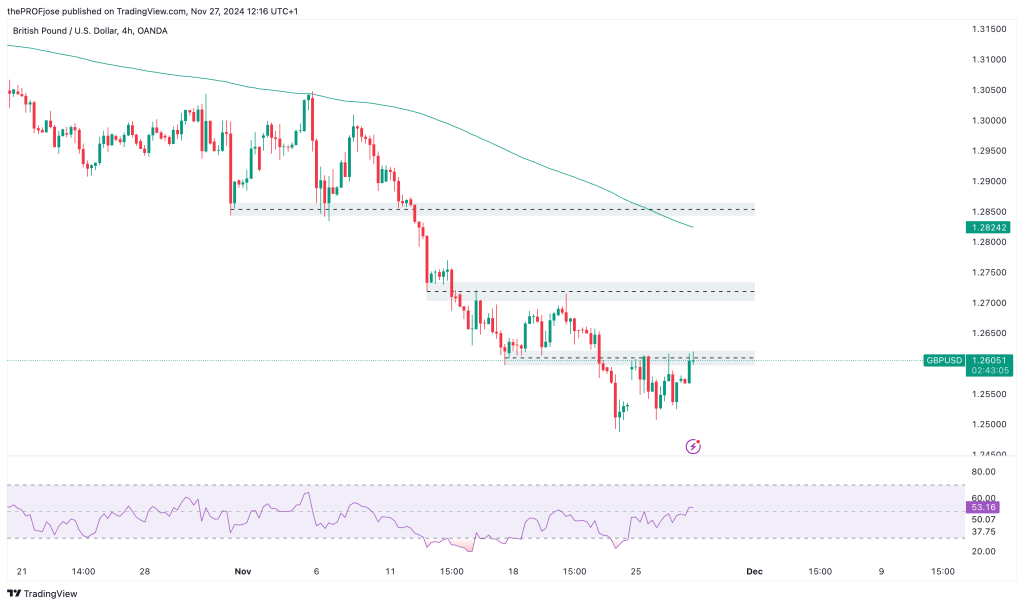
Looking at the GBP/USD chart, price action presents us with one of those tricky situations where the lower timeframe is trading at a counter-trend to the higher timeframe price action.
Let’s take a look at the 4-hour timeframe and give a breakdown of the chart:

The above chart shows that the Cable is currently bearish, as price is trading beautifully under the 200 EMA. Also, the swing low shows that the price had been oversold, hence the sharp retracement to the upside. However, the price is currently inside a key level zone, which might either push the price down or give a good opportunity for long traders.
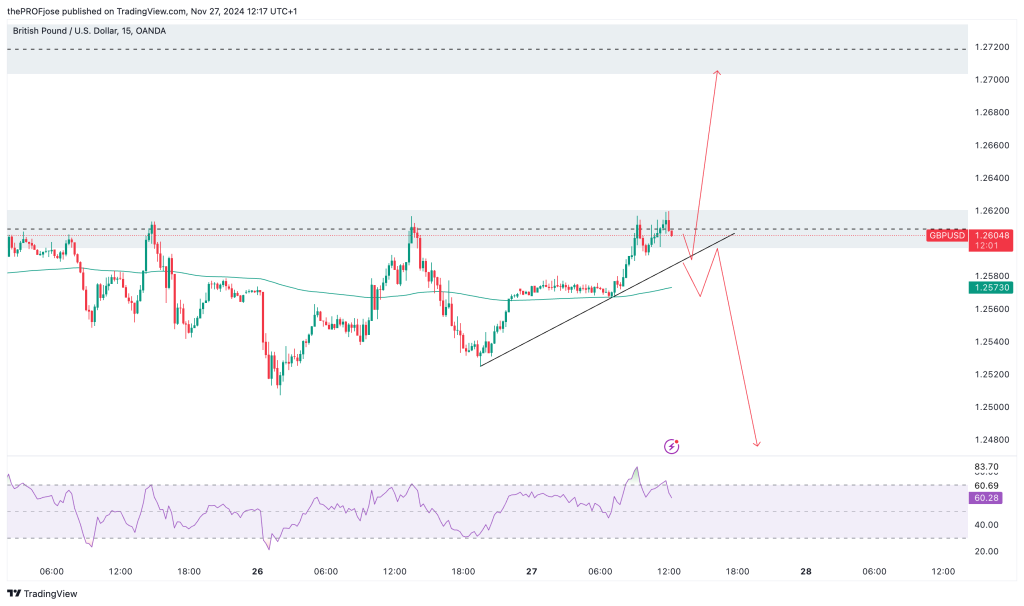
Since we only use the higher timeframe for our directional bias, we can switch to the 15-minute timeframe to get a better look at what the price may do today.

On the 15-minute chart, price is demonstrating a reluctant bullish market momentum. For instance, price is trending above the 200 EMA. However, the RSI suggests that price is overbought.
What do we do in this case? Simple: we set up our mechanical rules in place. That is “if the market does this…, then do this.” So, if the bullish trend line was broken to the downside and price closes below the 200 EMA, it’s a perfect opportunity to continue the SELL momentum from the 4-hour timeframe.
On a flipside, if price breaks above this key level and retest, we may want to go long and expect the bullish retracement to go further up, hopefully to the next key level.
GBP/USD Fibonacci Key Price Levels 27/11/2024
Short-term traders planning to invest in GBP/USD today should keep a close eye on the following key price levels for the day:
| Support | Resistance |
| 1.25225 | 1.26060 |
| 1.24967 | 1.26318 |
| 1.24549 | 1.26735 |
Risk Disclosure: The information provided in this article is not intended to give financial advice, recommend investments, guarantee profits, or shield you from losses. Our content is only for informational purposes and to help you understand the risks and complexity of these markets by providing objective analysis. Before trading, carefully consider your experience, financial goals, and risk tolerance. Trading involves significant potential for financial loss and isn't suitable for everyone.


