


Natural Gas experienced a -0.99% price decline today, following Monday’s positive change of +0.72%.
Key Points
- U.S. gas production grew 4.3% in 2023, led by Texas and New Mexico.
- Hurricane Helene caused supply disruptions, driving price volatility.
- Lower demand forecasts and reduced power generation are pushing prices down.
Natural Gas Daily Price Analysis – 01/10/2024
Natural Gas has seen notable price fluctuations recently, influenced by both supply disruptions and production gains. As of the most recent data, Natural Gas opened at $2.907 today but has dropped to $2.894, marking a -0.99% decline. This contrasts with Monday’s close, which saw a positive change of +0.72%, closing at $2.923.
Supply and Production Influences
The U.S. dry natural gas production has been on a consistent upward trend, increasing 4.3% year-over-year in 2023. The latest report from the U.S. EIA highlights this as a third consecutive year of production gains, with Texas and New Mexico driving most of the growth. Texas saw an impressive 7.4% increase, while New Mexico’s production rose by 15.3%. On the downside, Ohio’s output fell by 3%, reflecting regional variances in production levels.
Despite the overall rise in production, current market conditions are strained. A key driver of price volatility has been the supply disruption in the Gulf of Mexico due to Hurricane Helene, which halted approximately 17% of gas production in the region. This disruption has contributed to elevated futures prices, with Monday’s close reaching $2.90 per MMBtu, the highest since late July.
Demand Outlook and Consumption Trends
While production remains robust, demand forecasts have recently softened, leading to a price decline today. The aftermath of Hurricane Helene has left millions of homes and businesses in the Southeast without power, reducing natural gas consumption, particularly by power generators. Furthermore, lower demand forecasts for the next two weeks, coupled with the ongoing reduction in gas consumption by industrial sectors, have added downward pressure on prices.
That said, consumption in key sectors remains healthy, with industrial and electric power demand showing resilience. Deliveries of natural gas to the industrial sector have risen by 0.3%, while the electric power sector saw a more significant 6.9% increase. However, lower consumption in the residential and commercial sectors has offset some of these gains, leading to a more balanced outlook in overall demand.
Key Economic Data and News to Be Focus On
It is likely that Natural Gas prices will continue to experience near-term volatility. The market remains sensitive to any further disruptions, particularly in the Gulf of Mexico, as the region plays a critical role in the U.S. gas supply chain. Additionally, storage injection levels, which have been low due to earlier price declines and reduced production, will be a key factor to watch. If injection rates fail to pick up, it could further strain supply heading into the colder months, potentially driving prices higher.
In the short term, the ongoing recovery from Hurricane Helene and restoration of power across affected regions will dictate much of the market’s movement. Should demand rebound quickly as power generators ramp up operations, we could see a correction in today’s price decline. However, any delays in restoring power could keep prices under pressure.
Natural Gas Technical Analysis – 01/10/2024
Natural Gas has been bullish for a couple of days now. It’s currently breaking structure to the upside, above the 200 EMA. In the same vein, the RSI is getting ready to cross above the 50 level, indicating a large room for the price to still move to the upside.
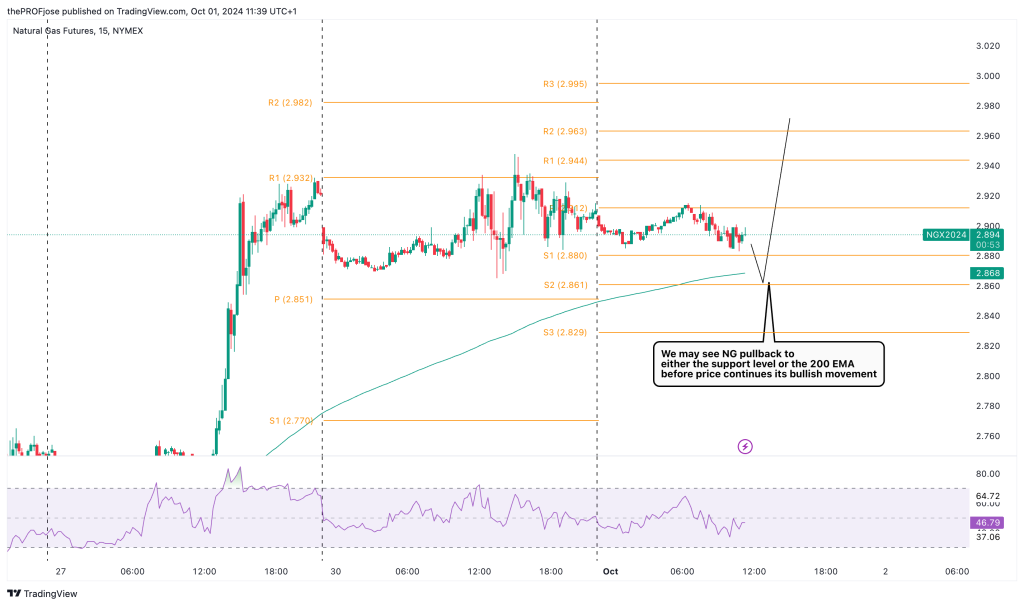
Should the price pullback to either the S1 or S2 support levels or the 200 EMA, NG may experience a continuation of the bullish trend in the short-term. However, should the price continue to dip below the support levels and eventually close below the 200 EMA, price may experience prolonged consolidation or a complete bearish reversal.
For now, short-term traders should keep an eye on buy setups in line with the trend.
Natural Gas Fibonacci Key Price Levels 01/10/2024
Short-term traders planning to invest in NG today should keep a close eye on the following key price levels for the day:
| Support | Resistance |
| 2.880 | 2.944 |
| 2.861 | 2.963 |
| 2.829 | 2.995 |
Risk Disclosure: The information provided in this article is not intended to give financial advice, recommend investments, guarantee profits, or shield you from losses. Our content is only for informational purposes and to help you understand the risks and complexity of these markets by providing objective analysis. Before trading, carefully consider your experience, financial goals, and risk tolerance. Trading involves significant potential for financial loss and isn't suitable for everyone.