
Lower-48 state dry gas production slightly declined year-over-year while gas demand increased, further tightening supply and supporting prices.
Key Points
- Natural gas prices closed at $2.587 last Friday, recovering 0.58% after midweek declines.
- Moderate temperatures are expected in the Eastern US, but above-average temperatures are projected for the next three months, boosting demand.
- Prices surged by 4.95% today, driven by strong LNG export demand and increased US electricity output.
Natural Gas Daily Price Analysis – 03/06/2024
Last week Friday, natural gas prices closed at $2.587, a modest increase of 0.58% from the opening price of $2.570. This recovery follows significant declines earlier in the week, with prices dropping by 5.63% on Wednesday and 3.53% on Thursday. The rebound can be attributed to a combination of factors, including a mixed near-term weather outlook and ongoing concerns about supply and demand dynamics.
The Eastern US is expected to experience moderate temperatures from June 6-13, reducing demand for natural gas from electricity providers. However, a projection by the National Weather Service indicating above-average temperatures for the majority of the lower 48 states over the next three months supported prices, suggesting higher cooling demand during the summer.
Currently, natural gas prices have opened at $2.645 and surged to $2.715, marking a substantial increase of 4.95%. Today’s price movement reflects the market’s response to several bullish factors, including strong demand for LNG exports and increased US electricity output. The Edison Electric Institute reported a 12.71% year-over-year increase in US electricity output for the week ending May 25. This is positive for natural gas demand as utility providers rely more on natural gas to meet higher electricity needs.
Today’s price surge is also influenced by lower-48 state dry gas production and increased gas demand. Production was reported at 100.3 bcf/day, a slight year-over-year decline, while demand rose to 66.8 bcf/day. Additionally, LNG net flows to US export terminals were 13.6 bcf/day, a 4.4% week-over-week increase, further tightening supply and supporting prices.
Key Economic Data and News to Be Released Today
Traders should monitor the release of the Final Manufacturing PMI data later today, with previous and forecasted values both at 50.9. This data could provide further insights into the economic health and industrial demand for natural gas. A higher-than-expected PMI could signal stronger industrial activity, potentially boosting natural gas demand and prices. Conversely, weaker data might exert downward pressure on prices.
Natural Gas Technical Analysis – 03/06/2024
Natural gas is currently bullish from a technical analysis point of view. In the early hours of today, the NG price crossed over the 200 EMA to the upside. However, because of the RSI’s position, it is not advisable to look for a BUY entry just yet.
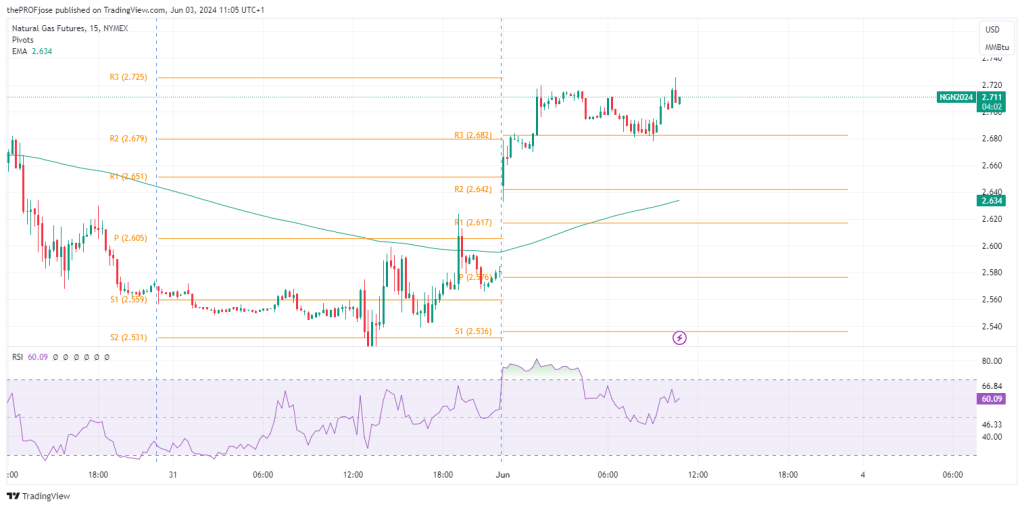
The RSI is trading close to the overbought price level, indicating that the price may experience a retracement or a complete reversal in the short term. In this scenario, it is advisable to wait for the upcoming high-impact news to give a clear direction to price action before entering a position.
Risk Disclosure: The information provided in this article is not intended to give financial advice, recommend investments, guarantee profits, or shield you from losses. Our content is only for informational purposes and to help you understand the risks and complexity of these markets by providing objective analysis. Before trading, carefully consider your experience, financial goals, and risk tolerance. Trading involves significant potential for financial loss and isn't suitable for everyone.