


Natural gas prices surged 8.72% today, following Wednesday’s 3.37% rise, driven by increased energy demand and weather patterns.
Key Points
- Increased electricity output and warmer weather are boosting natural gas demand.
- Hurricane Helene’s impact on U.S. Gulf production has diminished with revised forecasts.
- U.S. LNG exports remain strong as European gas storage surpasses seasonal averages.
Natural Gas Daily Price Analysis – 26/09/2024
Natural gas prices surged sharply today, closing at $2.867, following an 8.72% increase from its opening price of $2.829. This follows Wednesday’s rise of 3.37%, which saw the price move from $2.583 to $2.637. These movements are driven by several factors, ranging from weather patterns to broader energy market dynamics, as well as production and demand shifts in the U.S. and abroad.
Rising Energy Demand and Warmer Weather Outlook
One of the key drivers behind the recent rally in natural gas prices is the increased demand for energy across the U.S. The U.S. Energy Information Administration reported a 1% year-over-year increase in primary energy consumption during the first half of 2024. Natural gas consumption rose by the same margin, continuing to play a pivotal role in electricity generation. The increase in natural gas demand can also be attributed to a significant uptick in U.S. electricity output. With warmer-than-usual weather forecasted across most of the U.S. from late September into early October, air conditioning needs are expected to push electricity providers to ramp up their natural gas usage further.
The temperature-driven demand boost comes at a critical time as utility providers look to manage their energy loads. According to the Edison Electric Institute, electricity output in the U.S. for the week ending September 21 rose by 9.23% year-over-year, contributing further to the pressure on natural gas supplies.
Supply Concerns Eased by Hurricane Forecast Adjustments
Earlier concerns over potential disruptions to natural gas production from Hurricane Helene have largely subsided. Initial forecasts suggested that the storm would strike the U.S. Gulf Coast, home to about 5% of U.S. dry natural gas production, but updated models project a landfall farther east. This adjustment significantly reduces the likelihood of major disruptions to natural gas infrastructure in the Gulf of Mexico. However, there is still some risk if the storm strengthens further, as it is expected to reach Category 3 status before hitting the Florida panhandle.
LNG Exports and the Global Market
The U.S. continues to dominate the global LNG market, with exports remaining a significant factor in natural gas pricing. Although net flows to U.S. LNG export terminals were down 3% week-over-week, the country’s long-term growth in export capacity ensures a continued strong presence in international markets. This growth is supported by ongoing infrastructure development, with two new LNG export facilities set to come online by the end of 2024, further boosting export volumes.
In Europe, gas storage levels reached 94%, well above the 5-year seasonal average of 89%. This provides some relief for European consumers ahead of winter, but global market tightness could still persist as the U.S. and other exporters face high demand from both domestic and international consumers.
Production and Inventory Trends
U.S. natural gas production in the lower 48 states stood at 100.1 bcf/day, a 1.6% decline year-over-year. Meanwhile, demand has risen by 4.1%, tightening the supply-demand balance. Additionally, last week’s injection into natural gas inventories came in at +58 bcf, above market expectations of +56 bcf. This build was slightly bearish for natural gas prices, but inventories remain well above the 5-year seasonal average, which signals ample supply for now.
However, today’s price movement could be impacted by the upcoming EIA natural gas inventory report. The consensus is expecting a build of +52 bcf, a smaller increase than the previous week’s figure. If the actual data comes in lower than expected, it could reinforce concerns about tightening supply and further drive prices upward.
Check out our Crude Oil Q4 Forecast
Key Economic Data and News to Be Released Today
Traders will be closely watching the release of key economic data that could influence natural gas prices. Most notably, the U.S. EIA is expected to release its weekly natural gas storage report, which could confirm whether inventories are building in line with expectations or if the current tightness in supply will continue.
Additionally, any updates regarding Hurricane Helene’s trajectory or potential disruptions to energy infrastructure along the U.S. Gulf Coast will be closely monitored by the market. Weather forecasts and temperature projections for the coming week will also be significant, as continued warm weather could sustain higher demand from electricity providers.
Natural Gas Technical Analysis – 26/09/2024
The day started with a massive gap up on NG, while price is flying higher above the 200 EMA. However, the RSI is indicating a caution as price is currently overbought.
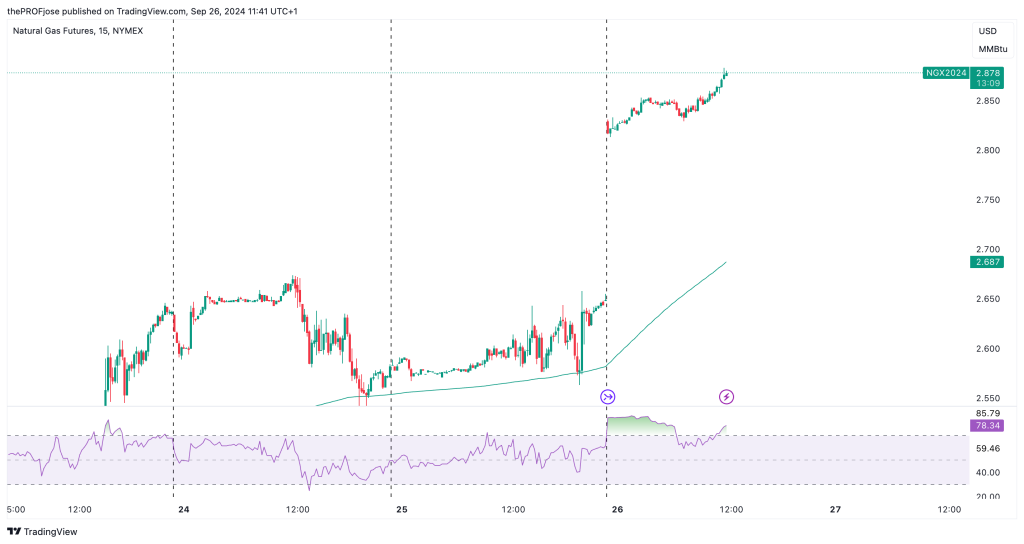
Given this market scenario today, rather than trying to predict where price is headed, it’s safer to set parameters in place that will guide how we behave in the market. So, the best entry point for a buy will be after price retrace to fill the gap and bounce off the 200 EMA. However, if price closes below the moving average, we may be looking to short the market in the short-term.
Risk Disclosure: The information provided in this article is not intended to give financial advice, recommend investments, guarantee profits, or shield you from losses. Our content is only for informational purposes and to help you understand the risks and complexity of these markets by providing objective analysis. Before trading, carefully consider your experience, financial goals, and risk tolerance. Trading involves significant potential for financial loss and isn't suitable for everyone.