


Natural gas prices continued their downward trend, with a 0.74% decline in early trading following Tuesday’s close at $2.311.
Key Points
- Warmer-than-expected U.S. weather forecasts are reducing heating demand.
- U.S. gas production and demand slightly declined, while LNG export flows dropped 10.6%.
- Increased U.S. electricity output and lower gas plant construction costs could support future demand.
Natural Gas Daily Price Analysis – 23/10/2024
Natural Gas prices have continued their downward trajectory following Tuesday’s close, with the market seeing modest declines. Tuesday’s close at $2.311 marked a slight loss of 0.04%, and today’s early trading showed further declines, with prices currently at $2.296, down 0.74% from the day’s open at $2.301.
The downturn in natural gas prices was largely attributed to updated weather forecasts predicting above-normal temperatures across the U.S., reducing the anticipated heating demand during the crucial late-October period. According to Atmospheric G2, the eastern two-thirds of the U.S. are expected to experience much warmer-than-normal temperatures from October 27 to October 31, further diminishing the need for natural gas as a heating source.
Supply and Demand Dynamics
On the supply side, Lower-48 state dry gas production on Tuesday was 101.2 billion cubic feet per day (bcf/day), a year-on-year decline of 2.9%, indicating a slight dip in available gas supply. Simultaneously, Lower-48 state gas demand was reported at 69.6 bcf/day, also reflecting a minor decrease of 1.1% year-on-year.
One significant factor was the decrease in LNG net flows to U.S. export terminals, which fell by 10.6% week-on-week to 11.8 bcf/day. Lower LNG export volumes could suggest weakened international demand, potentially exacerbating price declines domestically, as more supply remains within the U.S. market.
Positive Influences on Natural Gas Demand
Despite current market pressures, there are a few factors that could provide support to natural gas prices in the near term. Increased U.S. electricity output continues to bolster demand from utility providers. The Edison Electric Institute (EEI) reported that U.S. electricity output rose by 6.76% year-on-year for the week ending October 12, with total electricity output increasing 1.62% year-on-year over the past 52 weeks. This uptick in electricity generation positively impacts natural gas demand, as it remains a key fuel source for power generation in the U.S.
Additionally, the U.S. construction costs for natural gas-fired electricity generators fell by 11% in 2022. With falling construction costs, we could see further investment in natural gas-fired plants, potentially sustaining demand for natural gas in the medium term.
Ample Supplies and Rig Count Declines
On the supply side, natural gas inventories remain robust. The latest weekly EIA report, released last Thursday, showed a build of 76 bcf for the week ended October 11, which met market expectations. Although the build was slightly below the 5-year average of 96 bcf, total inventories remain 4.6% above the 5-year seasonal average. This signals ample supply, putting downward pressure on prices.
The latest rig count data from Baker Hughes also highlights a gradual decline in U.S. natural gas drilling activity, with the number of active rigs falling by two to 99 rigs for the week ending October 18. This is a notable drop from the 5-year high of 166 rigs seen in September 2022, but still slightly above the 3-1/3 year low of 94 rigs posted in early September.
Key Economic Data and News to Be Focus On
For today, there are no major U.S. economic releases directly related to natural gas prices. However, broader energy markets may react to ongoing geopolitical developments, especially in the Middle East, that could influence global energy supply chains.
Additionally, the updated U.S. weather forecasts will be closely monitored by traders, particularly given the much warmer-than-expected outlook through the end of October. Should these temperature trends extend further into November, we could see additional downward pressure on natural gas prices as the market adjusts to lower anticipated heating demand.
The market will also keep an eye on the upcoming EIA natural gas storage report, which could offer more insights into supply and demand fundamentals in the coming days.
Natural Gas Technical Analysis – 23/10/2024
The technical outlook on NG today suggests that price will continue to go down as the intraday trend remains bearish. From the chart below, you can see that Natural Gas is trading below the 200 EMA while the RSI shows even more room for some downward potential before price is oversold.
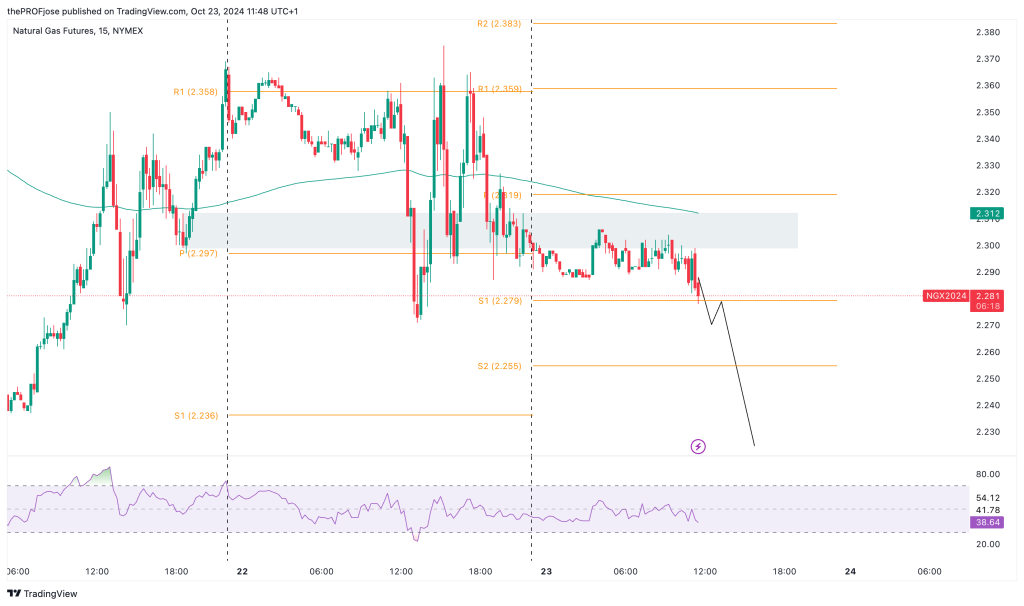
Although price is testing a series of key support price levels, we will most likely see price breaking below these levels, turning support to resistance as it goes down.
Natural Gas Fibonacci Key Price Levels 23/10/2024
Short-term traders planning to invest in NG today should keep a close eye on the following key price levels for the day:
| Support | Resistance |
| 2.279 | 2.359 |
| 2.255 | 2.383 |
| 2.215 | 2.423 |
Risk Disclosure: The information provided in this article is not intended to give financial advice, recommend investments, guarantee profits, or shield you from losses. Our content is only for informational purposes and to help you understand the risks and complexity of these markets by providing objective analysis. Before trading, carefully consider your experience, financial goals, and risk tolerance. Trading involves significant potential for financial loss and isn't suitable for everyone.